2022-11-11 14:53 |
Band Protocol price has emerged as a shining light in a difficult time for cryptocurrencies. The BAND coin jumped to a high of $2.84, which was about 115% above the lowest level this week. It has risen by over 30% in the past 24 hours, according to data compiled by Binance.
Why is BAND price rising?Band Protocol is a blockchain project that provides oracle services to developers. An oracle is a product that makes it possible for developers to pull off-chain data and bring it to the on-chain ecosystem.
For example, assume that you are building a decentralized sports betting platform. You will need external data on games in your platform. Now, instead of getting the off-chain data yourself, you will turn to an oracle provider and use API to incorporate it easily.
Band mostly provides price feeds on cryptocurrencies. These feeds are then common in DeFi platforms like Injective Protocol and Synthetix. It also provides datasets on foreign exchange and commodities.
Band Protocol operates in a highly competitive industry, where Chainlink dominates. Other leading players in the sector are WINKLink and Maker. Chainlink has the biggest market share in the industry by far.
It is unclear why the BAND price has jumped sharply amid a crypto turmoil. A likely reason is that the developers are working on the upcoming BandChain V2.4 launch. The new upgrade will introduce new features in its ecosystem.
Band Protocol has removed FTX from data sources since the situation started to unfold. We continue to monitor the situation closely and ensure sufficient sources to aggregate and report price data.
— Band Protocol (@BandProtocol) November 10, 2022
For example, it will change how gas is calculated in its ecosystem in a bid to make it cheaper for data providers. It will also reduce any risks to modifications of the Wasm code, and increase throughput by at least ten times. In other words, it will be able to reduce the time taken to run the same task from the worst-case scenario of 0.4 seconds to 0.03 seconds.
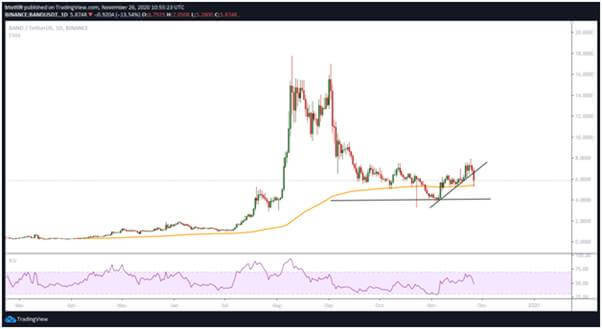
Band Protocol price forecastThe four-hour chart shows that the BAND price has made a strong recovery in the past two days. In this period, it has managed to move above the 25-day and 50-day moving averages. The Stochastic Oscillator has moved close to the overbought level. At the same time, the Relative Strength Index (RSI) has moved close to the overbought area.
BAND seems to be forming a bullish flag pattern. Therefore, there is a likelihood that it will continue rising during the weekend as buyers target the key resistance level at $3.3.
How to buy BAND CoinbaseCoinbase is a global cryptocurrency exchange. Its platform is well designed for beginner investors and it offers a wide range of coins, as it has over 100 to choose from. Coinbase has high level security built into the platform, a range of diverse features to use and it offers its users options for storing their crypto, such as being able to store coins on the Coinbase exchange.
Buy BAND with Coinbase today Disclaimer
BitpandaBitpanda is a digital assets brokerage company. It has grown to become one of the most popular crypto exchanges in the world, as it offers a user-friendly interface, it has developed a bunch of great features and it offers a variety of coins to invest in. Bitpanda has also built a reputation for security, and it has never experienced a hack of its data before.
Buy BAND with Bitpanda today
The post Band Protocol price forecast as it bounces back appeared first on CoinJournal.
origin »Bitcoin price in Telegram @btc_price_every_hour
Band Protocol (BAND) на Currencies.ru
|
|