2020-12-2 16:15 |
The technical outlook for yearn.finance (YFI) suggests a breakout to $30,000 if bulls break major resistance level
YFI price is up nearly 10% in the past 24 hours and over 21% in the past week to see its value against the US dollar rise above $28,000.
If the upside holds short term, amid the positive sentiment from recent news, yearn.finance could rally to $30,500.
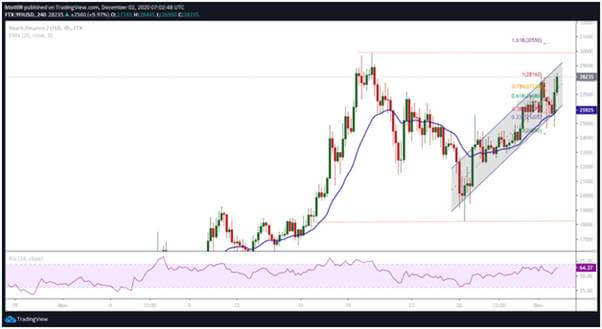
YFI/USD 4-hour chartAs seen on the 4-hour chart, bulls are largely in control. The last few sessions have included a recovery above the midline of an ascending parallel channel to suggest a continuation of the upside momentum could see YFI price hit a new high for the first time since 20 November.
At the time of writing, bulls are eyeing another higher high after printing consecutive green candles between $25,950 and $28,435.
If the uptrend sustains, a break to the upper boundary of the ascending channel will take YFI/USD to $29,500. The next target above this upside barrier is the 161.8% Fibonacci retracement level of the move from $29,956 high to $19,279 low. Should buying pressure push YFI price to the resistance line, YFI/USD will retest the $30,550 level.
Although bulls are likely to target the top of the parallel channel, the middle trendline is even more crucial to their near term objectives.
YFI/USD price 4-hour chart. Source: TradingViewIf profit booking near or around $28,000 increases downward pressure, the initial dip might take prices to the 78.6% Fibonacci retracement level ($27,330). If the downturn picks momentum, bulls might have to seek support at the 20-day exponential moving average at $25,925.
The downward action could turn into a bearish breakout if bulls fail to hold onto recent gains above the 20-EMA line, a scenario likely to see the digital asset retreat to lows of $24,000.
YFI/USD 1-hour chart YFI/USD 1-hour chart. Source: TradingViewThe hourly chart seems to support the above bearish outlook. As seen on the chart above, the TD Sequential indicator suggests YFI/USD is on the verge of posting a sell signal. The hourly outlook features a green ‘8’ candle whose validation will signal the possibility of increased downward pressure.
If the sell signal validates within the next few hours, yearn.finance price could decline to $27,049 (20-EMA on the hourly chart). From here bears could be looking at pushing prices down to $25,925.
However, an invalidation of the sell signal and a breakout above $28,000 would indicate a bullish outlook. In this case, YFI price could target 20 November highs near $29,900.
The post Yearn.finance price outlook suggests breakout to $30,000 appeared first on Coin Journal.
origin »Bitcoin price in Telegram @btc_price_every_hour
yearn.finance (YFI) на Currencies.ru
|
|


