2019-4-26 05:00 |
The cryptocurrency market saw a roller-coaster ride over the past couple of months, and that was reflected in the prices and market caps of top cryptocurrencies. XRP, the third largest cryptocurrency, was stuck in the bear trap with no room for any bullish movement, while Stellar Lumens [XLM], which performed well at the start of the bull run, shared a similar fate to that of XRP.
XRP 1 day
Source: TradingView
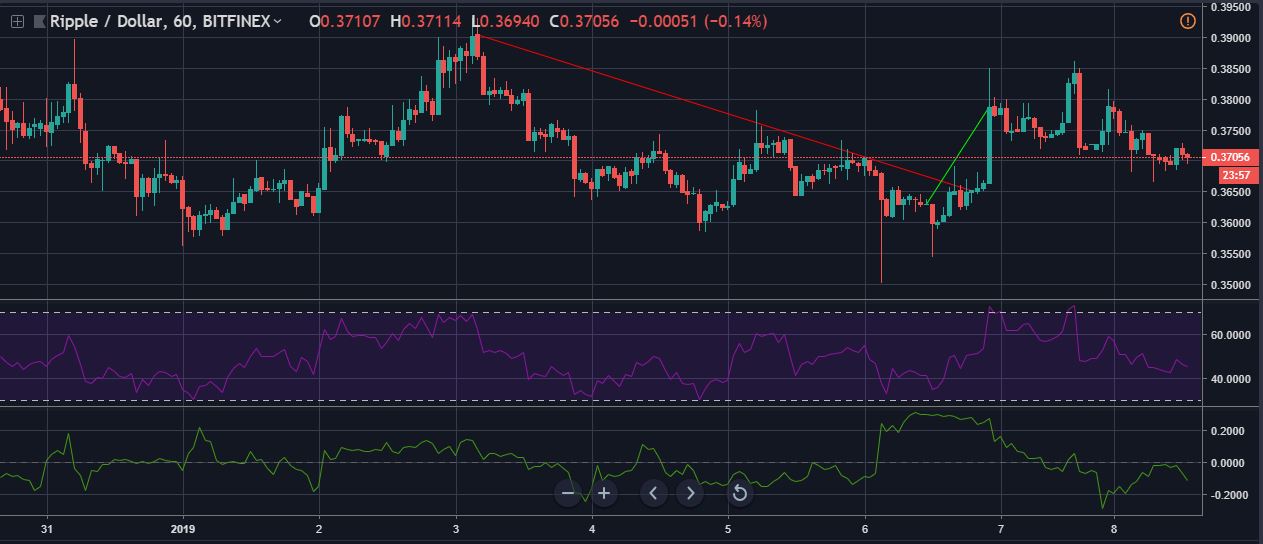
The one-day chart for XRP showed a downtrend that pulled the price from $0.517 to $0.371, while the long term support held at $0.291.
The Bollinger bands moved parallelly due to the continuous sideways movement of the market.
The Chaikin Money Flow indicator was below the zero line, as the capital leaving the market was much more than the capital coming into the market.
The Awesome Oscillator recorded low amplitudes due to the lack of market momentum in the XRP ecosystem.
XLM 1 day
Source: TradingView
XLM’s one day graph saw a drop in price from $0,278 to $0.138, while the long term support was at $0.074.
The Parabolic SAR was above the price candles which signified that the cryptocurrency was going through a bearish atmosphere.
The Relative Strength Index was closer to the oversold zone, a sign of the selling pressure being more than the buying pressure.
The MACD indicator underwent a bearish crossover that caused the signal line and the MACD line to converge below. The MACD histogram was a mix of bearish and bullish signals.
Conclusion
The above-mentioned indicators clearly indicated that the cryptocurrency market was still in a bearish trudge and that there was no bull run in sight. This was evidenced by the significant drop in market momentum.
The post XRP/USD and Stellar Lumens [XLM/USD] Price Analysis: Bear reigns as prices stagnate appeared first on AMBCrypto.
origin »Bitcoin price in Telegram @btc_price_every_hour
CK USD (CKUSD) на Currencies.ru
|
|


