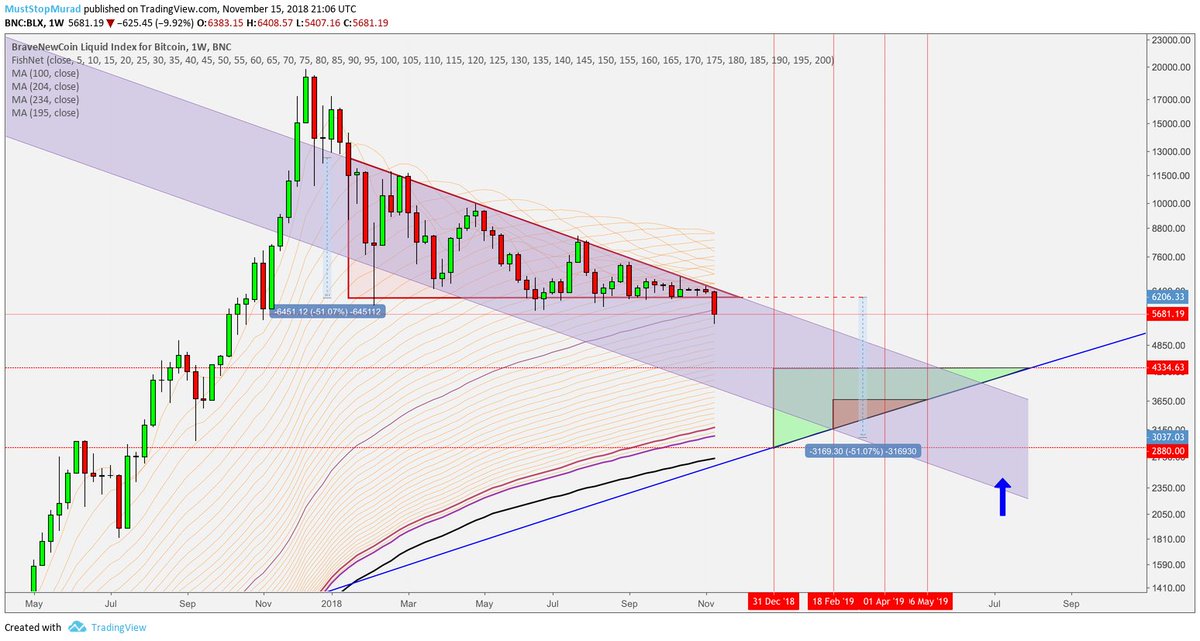
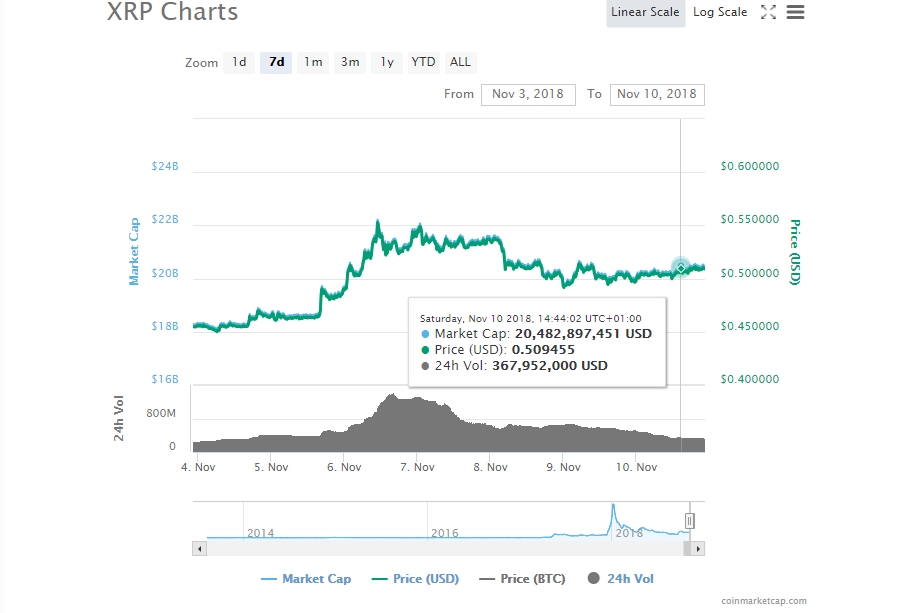
XRP has not fared as well as Bitcoin, Ethereum, and other top cryptocurrencies have over the past few weeks.
As the market leaders have stalled, trading in tight ranges, XRP has slid lower and lower. From May’s highs of approximately $0.23, the cryptocurrency has collapsed by 20% to $0.185 as of the time of this article’s writing.
The bearish price action, though, has allowed the altcoin to print a macro bull signal: a Tom Demark Sequential buy “9” candle on the weekly chart of XRP against Bitcoin (XRP/BTC).
The TD Sequential prints “9” and “13” candles when an asset reaches an inflection point in its trend. The Sequential, for instance, flashed a buy “9” and “13” candle at Bitcoin’s $6,400 lows in December of 2019, predicting the recovery to $10,500 that took place in the two months that followed.
XRP/BTC price chart with TD Sequential overlay shared by the Telegram channel “Alerts – TD 9’s & 13’s”. Chart from TradingView.com
Although many traders put their faith in the TD Sequential, a prominent analyst doesn’t expect the cryptocurrency’s bull case to play out.
XRP Strength Unlikely to Play Out, Top Analyst Says
Prominent commodity analyst Peter Brandt, who doubles as a Bitcoin bull, noted that the asset recently broke a level of crucial support. The support held on multiple occasions over the past two months and acted as a launchpad for XRP to rally from in 2017’s bull market.
Per Brandt, the loss of this support could lead to a 90% correction in the price of XRP against Bitcoin. This harsh prediction is predicated on the fact that the cryptocurrency has little historical liquidity under the current price until a strong correction takes place.
XRP/BTC chart from Peter Brandt. Chart from TradingView.com
Brandt’s bearish analysis of XRP comes a month after he branded the cryptocurrency a “manipulated market and a dead end.”
The trader often bashes the cryptocurrency’s high levels of inflation, which investors like Multicoin Capital’s Kyle Samani believe provides a natural downtrend for the asset.
Not the Only Bear
Brandt isn’t the only one predicting that XRP may never come close to revisiting its 2018 heights.
One trader shared the chart below earlier this year, noting that while certain companies had “promising tech” as XRP may have, their stocks/native assets didn’t rally. That’s to say, just because XRP may be a promising technology does not mean it will rally:
“Here are just a few of the hundreds of 10-year charts you can find for ‘promising tech’. See a similarity? Many of these same charts have forums of people still talking about the recovery to come.”
Charts from trader “Cantering Clark” drawing lines between the stocks of questionable companies and the cryptocurrency.
Featured Image from Shutterstock
Price tags: xrpusd, xrpbtc
Charts from TradingView.com
XRP Prints a Macro Bull Signal: A Top Analyst Says It's Still Poised to Crash origin »
Key Highlights • XRP/USD now features series of lower swing lows than lower swing highs below a $0. 20 mark. • $0. 18 remains a critical price line of XRP/USD bearish trend. • Bears will stop around $0.
Support for XRP moving forward: $0.3185, $0.3106, $0.3028, $0.2989, $0.2858. Resistance for XRP moving forward: $0.3291, $0.3361, $0.3449, $0.3635,…
The post Ripple Price Analysis: XRP/USD Continues to Trade at Lower Boundary — Are the Bears Preparing to Head Lower? appeared first on Invest In Blockchain.
Ripple price corrected lower and tested the $0. 3130 support area against the US dollar. There was a break above a key declining channel with resistance at $0. 3145 on the hourly chart of the XRP/USD pair (data source from Kraken).
BTC/USD From yesterday’s low at $3556. 6 when the price of Bitcoin dipped to the lower support level we have seen the price increase by 3. 15% as it came up to $3668 on an impulsive move to the upside.
Ripple price strong supports from around 30 cents Valor Foundation plans of hard forking the Ripple Ledger XRP demand grows in lower time frames, volumes rise Even though Jan 20 sellers did wipe out strides, XRP did find support at around 30 cents.
Support for XRP moving forward: $0.3118, $0.3106, $0.3028, $0.2989, $0.2858. Resistance for XRP moving forward: $0.3291, $0.3361, $0.3449, $0.3635,…
The post Ripple Price Analysis: XRP Approaches Lower Boundary of Trading Range — Can the Bulls Defend This Critical Level? appeared first on Invest In Blockchain.
Ripple prices stable above 30 cents SWIFT—Ripple competition should heat up in coming days Transactional volumes low and dropping XRP success depends on adoption. That’s why an increase in xRapid users is bullish for investors.
XRP’s price has been becoming increasingly bearish as the week progresses. Last week, the price of XRP broke bearishly out of a descending triangle which is a typical trend continuation pattern.
Mercury FX is trying to change the way people and businesses make international transactions. Their mission is to beat banks by providing customers with lower “exchange rates and lower transaction fees on all international transactions.
Ripple price stable above 30 cents Ryan Zagone concludes lack of regulatory clarity impedes institutional adoption Average volumes decrease from 30 million to 24 million in three days Technically, XRP is bullish above 30 cents and 25 cents.
Cuallix has recently praised the financial solution provided by Ripple. The market is now trading in a newly establish…
The post Ripple Price Analysis: XRP Enters Newly-Established Lower Trading Range — Can the Bulls Bring Price Action Back Above $0.3449? appeared first on Invest In Blockchain.
Ripple price traded to a new weekly high at $0. 3384 and later corrected lower against the US dollar. There was a break below a key bullish trend line with support at $0. 3250 on the hourly chart of the XRP/USD pair (data source from Kraken).
Ripple price recently gained bullish momentum above the $0. 3650 resistance against the US dollar. There was a break above a key triangle with resistance at $0. 3665 on the hourly chart of the XRP/USD pair (data source from Kraken).
Ripple price traded lower recently and tested the $0. 3580 support against the US dollar. There is a major bullish trend line with support at $0. 3530 on the hourly chart of the XRP/USD pair (data source from Kraken).
Ripple price tested the key 0. 0000975BTC resistance against bitcoin. XRP is currently moving lower towards the 0. 0000940BTC support where buyers may emerge. Key Talking Points Ripple price faced a major resistance near the 0.
Key Highlights Ripple price failed to move above $0. 3800-$0. 3850 and later corrected lower against the US dollar. There is a major bearish trend line formed with resistance at $0. 3700 on the hourly chart of the XRP/USD pair (data source from Kraken).
Key Highlights Ripple price traded lower recently and broke the $0. 3550 and $0. 3440 supports against the US dollar. There is a major bearish trend line formed with resistance at $0. 3560 on the hourly chart of the XRP/USD pair (data source from Kraken).
A look at the Weekly chart in logarithmic form for Ripple’s XRP shows that price retouched support at $0. 25-$0. 30 once more, and similarly to the last time a short rally ensued. However, in comparison to the one in early September, the rally was shorter and with lower volume.
Key Highlights Ripple price extended gains and traded towards the $0. 4000 resistance area against the US dollar. There is a major bullish trend line in place with support at $0. 3450 on the hourly chart of the XRP/USD pair (data source from Kraken).
Messari. io has turned OnchainFX into a real beast since acquiring them earlier this year. The number of data points available on their site is growing with each passing day and they, along with coinmetrics.
The markets are back on a downward trajectory after the market leader Bitcoin reversed its weekend gains and heads towards forming a new 2018 low. Ripple’s XRP is also on a downward trajectory as it dropped below the key $0.
XRP/USD Medium-term Trend: Bearish Resistance Levels: $0. 34, $0. 35, $ 0. 36 Support Levels: $0. 33, $0. 32, $0. 31 XRP is bearish on the medium-term outlook. The bears hold tight to the XRP market as it can be seen on the chart that the candle is making lower lows.
Ripple price is under pressure and declined below $0. 3450 recently against the US Dollar. XRP/USD could continue to move down below $0. 3000 or $0. 2800. Key Talking Points Ripple price recently broke the $0.
Ripple has formed lower highs and lower lows to trend lower inside a descending channel on the 1-hour time frame. Price just came off a bounce from the resistance and is due for a move to the swing low or the channel bottom around .
Technically, XRP/USD is bullish. As long as prices are trending above 35 cents, buyers can continue ramping up in lower time frames. This is so because the coin is increasingly becoming a utility and a store of value thanks to its low volatility—down 22 percent in the last week compared to BTC at 32 percent.
XRP lost its immunity to the market swings and started dropping just like other coins. Here are couple of possible scenarios for XRP: $xrp $btc shorted retest of H1 -ob. First target shown. Think this goes much lower.
The Black Friday has reached the virtual currency market. Bitcoin (BTC), Ethereum (ETH) and other virtual currencies are being traded between 5% to 10% lower than 24 hours ago. Bitcoin can be purchased under $4,300 and Ethereum under $125 dollars.
When an overwhelming number of cryptocurrency investors thought it couldn’t get any worse, it did. Bitcoin (BTC), after falling under $5,800 on November 14th, continued lower on Monday and Tuesday morning, moving under a multitude of supposed support levels at $5,000, $4,800, and, most recently, $4,400.
Ripple is consolidating inside a symmetrical triangle pattern with its higher lows and lower highs. This digital asset has been particularly resilient, despite the sharp declines seen in the crypto market in the past few hours.
Latest Ripple News Aside from EOS and Stellar Lumens which are recent inventions, it still beat logic that CoinBase is yet to list XRP. While it is understandable that CoinBase can practice their discretion and list any coin that adheres to their listing framework, XRP is a liquid asset and far more than just being.
A similar market sentiment has taken over almost all leading crypto-coins prices for the past few days. With sellers having their saying on the 8th of November, values returned lower after a noticeable bull-run but the weekly end-result is by no doubt positive as digital assets have taken position on a higher trading ground.
Key Highlights Ripple price traded as high as $0. 5626 and later corrected lower against the US dollar. There was a break below a major bullish trend line with support at $0. 5300 on the hourly chart of the XRP/USD pair (data source from Kraken).
Ripple price rallied this week and broke key resistances at $0. 4750 and $0. 4950 against the US Dollar. XRP/USD remains well bid on the downside around $0. 5000. Key Talking Points Ripple price traded above the $0.
Key Highlights Ripple price extended gains towards $0. 5620 before started a downside correction against the US dollar. There are two bullish trend lines in place with support at $0. 5320 and $0.
Key Highlights Ripple price traded further higher and broke the $. 0. 4600 resistance area against the US dollar. There was a break above a declining channel with resistance at $0. 4535 on the hourly chart of the XRP/USD pair (data source from Kraken).
Ripple is one of the most important companies in the cryptocurrency world. It has expanded to many different financial institutions and it continues to do so. Dilip Rao, Ripple’s global head of infrastructure innovation, said that the company’s products can help boost Islamic finance.
Key Highlights Ripple price corrected higher recently and tested the $0. 4500 resistance area against the US dollar. There was a break above a key bearish trend line with resistance at $0. 4400 on the hourly chart of the XRP/USD pair (data source from Kraken).
Ripple price tested the $0. 4735 resistance recently and corrected lower against the US Dollar. XRP/USD is currently testing the previous resistance at $0. 4490-0. 4500. Key Talking Points Ripple price was recently rejected from the range resistance at $0.
Ripple’s digital currency XRP was on a downward spiral at the start of this month. The downward spiral was catalyzed by a bearish divergence which took place between price and RSI. The bearish divergence resulted in price forming higher highs while RSI formed a lower high, indicating that price continued to increase despite buying pressure […]
Ripple XRP Price Recovers Since 0x Project [ZRX] Listing was originally found on [blokt] - Blockchain, Bitcoin & Cryptocurrency News.
Ripple is forming another lower high to create a descending channel visible on its 4-hour time frame. Price could make its way back down to the channel support if the selloff resumes from here, possibly aiming for the Fib extension levels as well.
Key Highlights Ripple price is currently trading below the $0. 4615 and $0. 4660 resistance levels against the US dollar. There was a break below a contracting triangle pattern with support at $0.
Key Highlights Ripple price failed to stay above the $0. 4600 support and declined recently against the US dollar. There was a break below an ascending triangle pattern with support at $0. 4630 on the hourly chart of the XRP/USD pair (data source from Kraken).
While the market leader Bitcoin has returned to consolidation with low volume trading, the third largest cryptocurrency by market capitalization has been making some significant movements. Ripple’s digital currency had been on a downward spiral since a bearish divergence occurred between price and RSI at the start of October.
Key Highlights Ripple price declined further and traded towards the $0. 3600 support zone against the US dollar. There is a monster bearish trend line in place with resistance near $0. 4290 on the hourly chart of the XRP/USD pair (data source from Kraken).
Today has been a bleak day for Bitcoin. The price looked like it was holding steady at the $6,500 mark but now it has dropped 5% which has dragged everything else down with it, including Ethereum, XRP, Cardano, Stellar and more.
Chart for ADA/USD (1W) Cardano (ADA) is the cryptocurrency with the highest probability of being listed next on Coinbase. Cardano (ADA), which is supported by IOHK, is the firm run by Charles Hoskinson, the founder of Cardano (ADA).
XRP/USD Medium-term Trend: Bearish Resistance Levels: $ 0. 61, $0. 63, $ 0. 65 Support Levels: $0. 45, $0. 43, $0. 41 Yesterday, October 8, the XRP price was in a bearish trend. The XRP price had been bearish in the last 48 hours.
Ripple’s token XRP spike in price in anticipation of the launch of its service xRapid. The launch of xRapid was announced at the Swell Conference last week in San Francisco. The price of XRP has since started to decline.
Ripple price is trading nicely above the $0. 5050 support against the US Dollar. XRP/USD is likely to extend gains above the $0. 5600 and $0. 5750 levels in the near term. Key Talking Points Ripple price is currently correcting lower from the $0.
All across the cryptocurrency community, there’s buzz once again about an altcoin season. But it may not only be current market participants driving the current surge in altcoins. Google Trends shows that search queries for “altcoins” have reached the second-highest point in all of 2020.