XRP Price to $10? Bulls Just Defended the Key Zone Exactly as Planned

XRP Price to $10? Bulls Just Defended the Key Zone Exactly as Planned
фото показано с : captainaltcoin.com

2026-1-8 22:30

Ripple’s XRP stood out again the moment price reacted where many traders expected it to. The $1.80–$1.70 zone held firm, and buyers stepped in with confidence. That bounce changed the short-term picture and confirmed that this area is still a key support level.

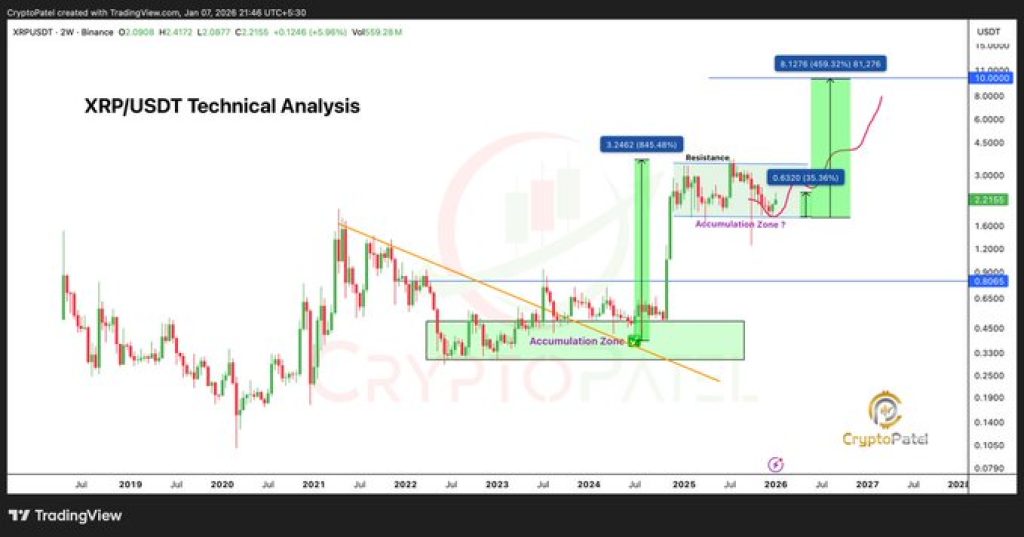
Top analyst Crypto Patel pointed out this region earlier, and the market performed as expected. After testing support, the price of XRP surged, reaching the $2.41 region, providing a gain of approximately 35% from the lower levels.

The speed of the move matters here. This was not a slow grind higher, but a sharp response, which usually points to real buying interest.

What the XRP Chart Is Showing Right Now

On the higher timeframe chart, the XRP price spent a long period building a base before the recent breakout. That accumulation phase laid the groundwork for the current move. Once price broke higher, it did not fall back into the old range. Instead, it pulled back shallowly and held above prior resistance.

This type of structure often signals strength. Markets that are weak tend to give back gains quickly. XRP did the opposite. It held its ground and began forming higher lows, which keeps the bullish structure intact for now.

Another important detail on the XRP chart is how clean the levels are. Support around $1.80 was respected almost perfectly, and resistance zones are clearly defined above. This makes the current setup easier to read compared to more chaotic price action.

Source: X/CryptoPatel Short-Term Targets: Where XRP Could Head Next

With support holding, attention now shifts to the upside. The next short-term target sits between $3.00 and $3.50. This area is a major decision zone, where sellers are expected to show up again.

If the XRP price reaches this range and struggles, consolidation would be a normal outcome. That would not break the bullish structure, as long as price holds above prior support. It would simply mean the market needs more time to absorb supply.

Nonetheless, if XRP is able to break above the $3.50 level and hold it well, the scenario changes considerably. At this point, XRP will have moved above the most recent levels of resistance, which will trigger a quicker move.

Read Also: Why PEPE, XRP, Solana Are Back In The Best Crypto to Buy Conversation

When Does the $10 XRP Scenario Come Into Play?

The $10 discussion is not about tomorrow or next week. It becomes relevant only if XRP clears $3.50 and confirms acceptance above it. On the chart, there is relatively little resistance between that zone and much higher levels.

This is why analysts frame $10 as a longer-term target tied to structure, not hype. Markets tend to move in stages. First, support must hold. Then resistance must break. Only after that do larger price targets start to make sense.

Right now, the XRP price is doing the most important thing it needs to do, respecting key levels. Bulls defended support exactly as planned, and the trend remains constructive as long as that holds.

The next test is clear. Can XRP push through $3.50, or will it need more time to build strength below resistance? Either way, the market has shifted from drifting sideways to reacting decisively. And when price starts reacting cleanly, that’s usually when the bigger moves begin.

Subscribe to our YouTube channel for daily crypto updates, market insights, and expert analysis.

The post XRP Price to $10? Bulls Just Defended the Key Zone Exactly as Planned appeared first on CaptainAltcoin.

origin »

Bitcoin price in Telegram @btc_price_every_hour

ETH/LINK Price Action Candlestick Set (LINKETHPA) на Currencies.ru

$ 0 (+0.00%)
Объем 24H $0
Изменеия 24h: 0.00 %, 7d: -2.75 %
Cегодня L: $0 - H: $0
Капитализация $0 Rank 99999
Цена в час новости $ 467.1 (-100%)

price key xrp zone confidence bounce firm

price key → Результатов: 126


Steem Price Analysis STEEM / USD: Catastrophic Loss

Steem has a bearish short-term outlook, with the STEEM / USD pair trading below key support on the four-hour time The STEEM / USD pair has a bearish medium-term outlook with a death cross currently underway on the daily time frame The daily time frame shows that the cryptocurrency is starting to trade below the […] The post Steem Price Analysis STEEM / USD: Catastrophic Loss appeared first on Crypto Briefing.

2019-8-12 16:49


Bitcoin Cash Price Analysis BCH / USD: Rallying Cry

Bitcoin Cash has a bullish short-term bias, with the BCH / USD pair recovering above its 200-period moving average on the four-hour time frame The four-hour time frame shows the presence of a bullish ascending triangle pattern The daily time frame highlights that the BCH / USD pair is still trading above its key 200-day […] The post Bitcoin Cash Price Analysis BCH / USD: Rallying Cry appeared first on Crypto Briefing.

2019-8-12 16:19


IOST Price Analysis IOST / USD: Swift Development

IOST has a bullish short-term trading bias, with the cryptocurrency recovering above its key 200-period four-hour time frame The four-hour time frame shows that the IOST / USD pair has broken above an ascending wedge pattern The daily time frame shows that the IOST / USD pair has now moved back inside a neutral wedge […] The post IOST Price Analysis IOST / USD: Swift Development appeared first on Crypto Briefing.

2019-8-8 17:13


Lambda Price Analysis LAMB / USD: Going Strong

Lambda has a bearish short-term bias, with price still trading below key technical resistance on the four-hour time frame The four-hour time frame shows that a large inverted head and shoulders pattern is building The daily time frame highlights that the cryptocurrency is attempting to build strength above its 50-day moving average Lambda / USD […] The post Lambda Price Analysis LAMB / USD: Going Strong appeared first on Crypto Briefing.

2019-8-8 17:02


Decred Price Analysis DCR / USD: Bright Future

Decred has a bullish short-term outlook, with price breaking above key resistance on the four-hour time frame The four-hour time frame shows that DCR / USD bulls are attempting to invalidate a bearish head and shoulder pattern The daily time frame highlights that a huge inverted head and shoulders pattern could start to take shape […] The post Decred Price Analysis DCR / USD: Bright Future appeared first on Crypto Briefing.

2019-8-6 16:01


Фото:

Bitcoin Price Analysis: Bulls Pushing BTC Towards $11,000

In my previous analysis, we looked at how bitcoin price action was trading in a key decision point. Now BTC bulls are heading back towards the $11,000 price mark forming a new uptrend. Bitcoin Price 1-Hour Chart On the 1 Hour chart for XBT/USD, we can see how the recent breakout of the asymmetrical triangle mentioned in a previous analysis has progressed over the last 3 days.

2019-8-3 19:16


Bitcoin Cash Price Analysis BCH / USD: Lifting Itself Up

Bitcoin Cash has a neutral short-term bias, with the BCH / USD pair trading towards its key 200-period moving average on the four-hour time frame The bearish head and shoulders pattern on the four-hour time frame has now reached its full downside projection The daily time frame continues to show the BCH / USD pair […] The post Bitcoin Cash Price Analysis BCH / USD: Lifting Itself Up appeared first on Crypto Briefing.

2019-8-2 16:21


Monero Price Analysis XMR / USD: Against The Ceiling

Monero has a bearish short-term trading bias, with the XMR / USD pair trading below its key 200-period moving average The four-hour time shows that the XMR / USD pair is trapped within a triangle pattern The daily time frame shows that a bearish head and shoulders pattern is currently in play Monero / USD […] The post Monero Price Analysis XMR / USD: Against The Ceiling appeared first on Crypto Briefing.

2019-8-2 15:59