2019-11-20 15:00 |
For the umpteenth day in a row, Bitcoin (BTC) has bled out. In fact, as reported by NewsBTC on Monday, the cryptocurrency fell as low as $8,000 last trading session, plunging by 5% as bulls failed to step in while bears asserted their dominance.
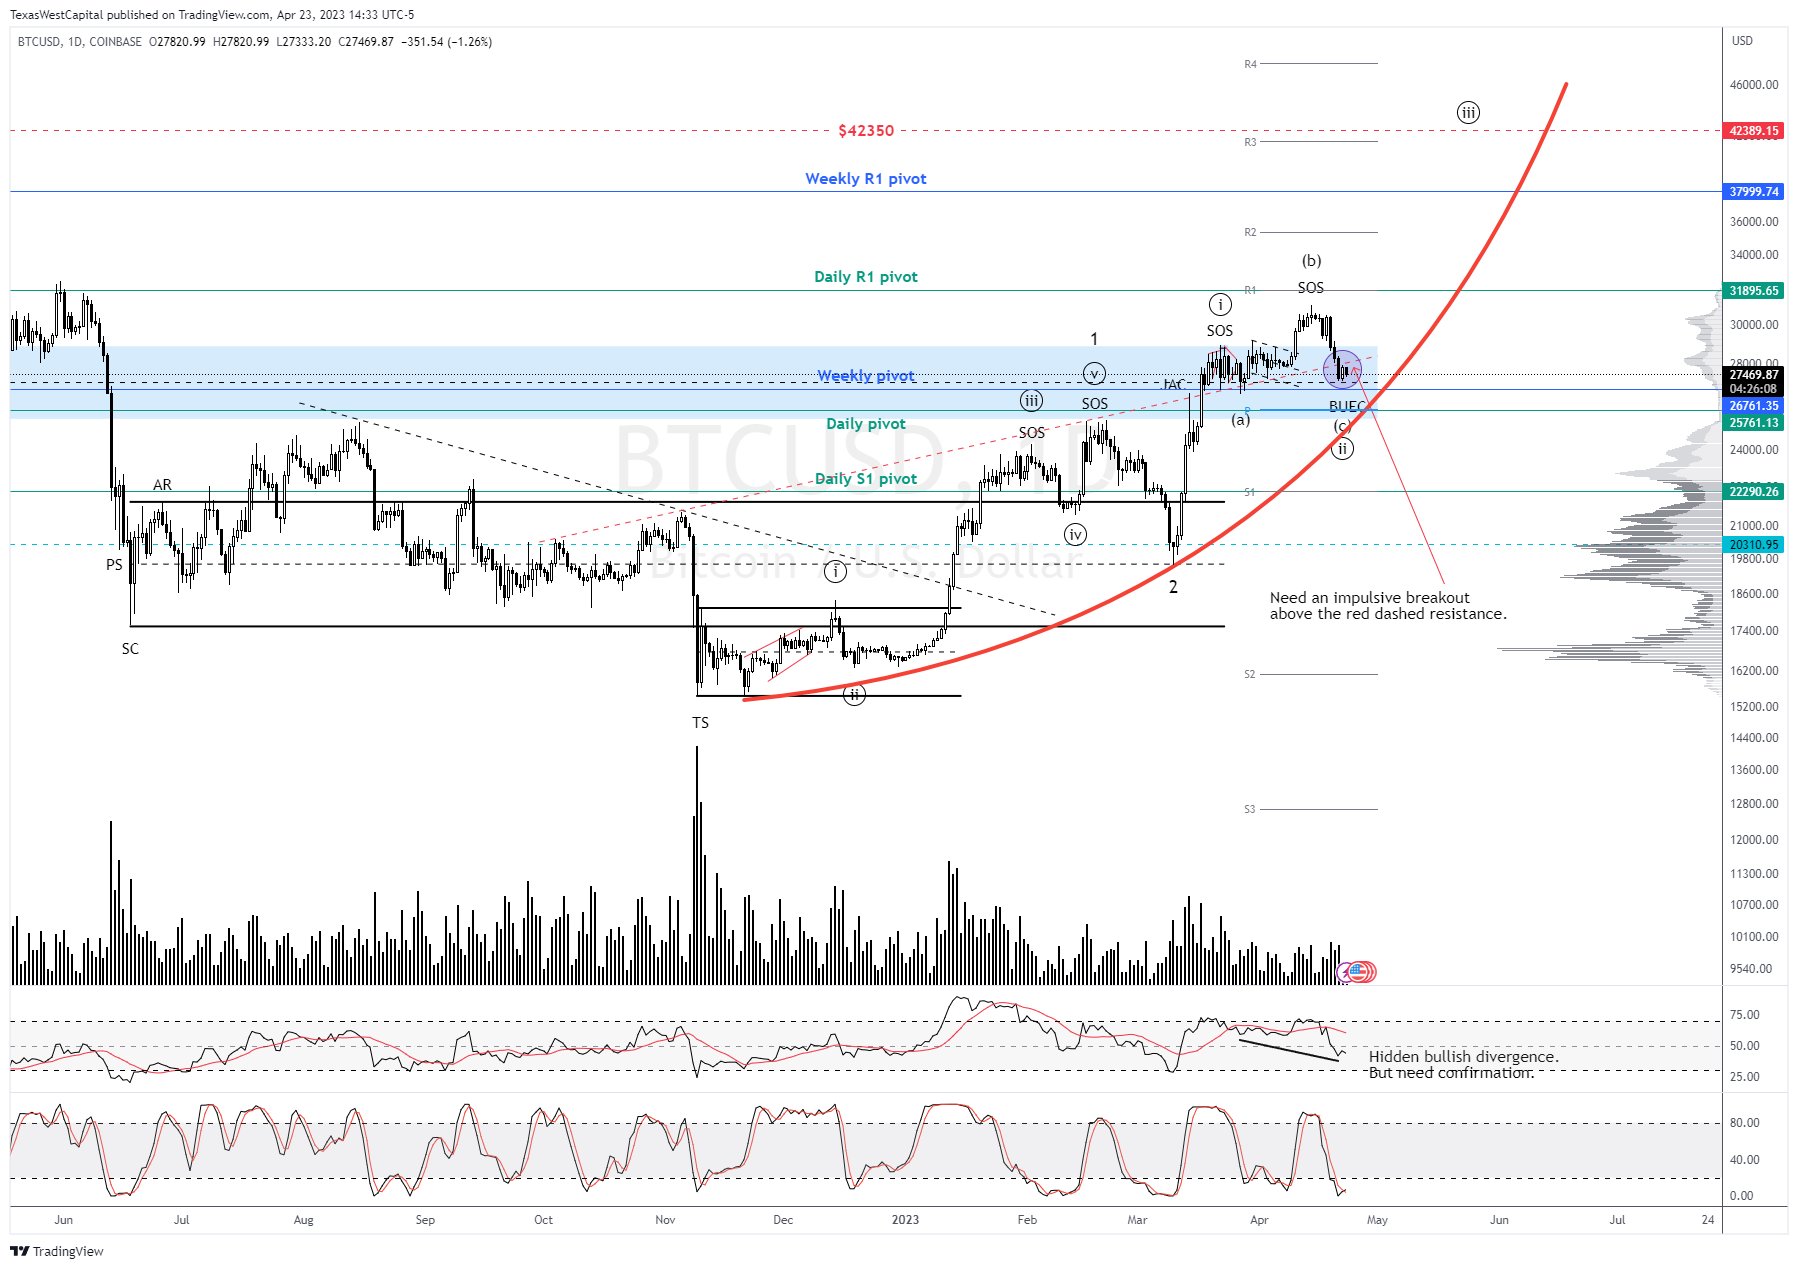
This bearish price action, which has been going on for months now — save for a few moments of reprieve — has made many wonder at which point Bitcoin will bottom. According to a popular crypto trader’s interpretation of a technical study by legendary chartist Richard Wyckoff, the bottom came in at $7,300.
Related Reading: Bitcoin Fixes This: Top Bank Chief Says Monetary Policy is Failing Is the Bitcoin Bottom In?Trader Coiner Yadox recently noted that Bitcoin’s price action from the long-term bottom of $3,150 established in December of 2018 until now looks much like a textbook Richard Wyckoff pattern, which is marked by a strong surge upward after a bear market, a double-top pattern, an accumulation throwback, and then a bullish continuation after a bullish breakout.
Yadox suggested that should his interpretation of this Wyckoff pattern be correct, Bitcoin found a medium-term bottom at $7,400, and will soon see a strong breakout to the upside.
$BTC $BTCUSD
LOL, tell me this isn't $btc in 2019 pic.twitter.com/e3FtsKG4SV
— Coiner-Yadox (@Yodaskk) November 18, 2019
It isn’t only Wyckoff studies that support the idea of a Bitcoin bottom being in. Per previous reports from NewsBTC, cryptocurrency-centric research boutique Delphi Digital noted that Bitcoin’s volume profile, the amount of cryptocurrency that was traded, has printed clear signs that a bottom is in. More specifically, the market printed signs of weak volume (capitulation), a short accumulation at the bottoming range, then a surge out of accumulation into a potentially new bull phase.
They added that they currently see the cryptocurrency market very tied to risk assets, like the S&P 500. With risk assets setting new all-time highs on Friday after a strong jobs report and a potential trade deal, it could be said that BTC will surge higher with the risk assets.
Related Reading: $150,000 to $300,000: What Big Firms are Targeting For Long Term Bitcoin Predictions Not So FastWhile Bitcoin’s price action over the past few months looks near identical to Wyckoff’s studies, there is one indicator of utmost importance that suggests Yadox’s hopium is misguided.
The indicator in question is the Hash Ribbons. The ribbons, which track the health and sentiment of Bitcoin miners, show that miners are on the verge of capitulating, which is what happened in mid-November, just before BTC began to tumble from $6,000 to $3,000.
MINERS ARE CAPITULATING
1/ Hash ribbons is on the brink of inversion. That’s news you never want to hear.
Inversion signals a downturn in hashrate. It's a leading indicator of miner capitulation. $BTC is dangling on the edge of a cliff. pic.twitter.com/i1ULrPIKJf
— Cole Garner (@ColeGarnerBTC) November 19, 2019
Miner capitulating, for those unaware, is when “small miners get backed into a corner when BTC price is low & the generation of mining hardware they use becomes obsolete.” The important part of this is that the capitulation of miners induces the sale of mined Bitcoin en-masse, pushing prices lower in a vicious cycle: “Undercapitalized miners panic sell, price dumps, longs get squeezed, stop losses cascade.”
Related Reading: Bitcoin Volume Lowest Since BTC Was at $4,000: Price Breakout Near Featured Image from ShutterstockThe post Wyckoff Study Suggests Bitcoin Bottom In, Price Could Pass $14,000 appeared first on NewsBTC.
origin »Bitcoin price in Telegram @btc_price_every_hour
Bitcoin (BTC) на Currencies.ru
|
|


