2020-8-26 15:00 |
Bitcoin has undergone a sharp correction in the past day, falling as low as $11,150. This drop comes despite a push from the asset towards $11,900 on the weekend. Bitcoin’s latest leg lower coincides with weakness in the value of gold, which has been struggling as the U.S. dollar bounces. BTC now trades for $11,350 as of this article’s writing as buyers have stepped back in. An analyst has noted that despite the selling pressure, there is actually a silver lining in that indicators suggest it should have dropped further. This may suggest that there is latent buying interest in the Bitcoin market that will limit downside moving forward. Bitcoin Hasn’t Fallen as Much as Some Thought It Would Have
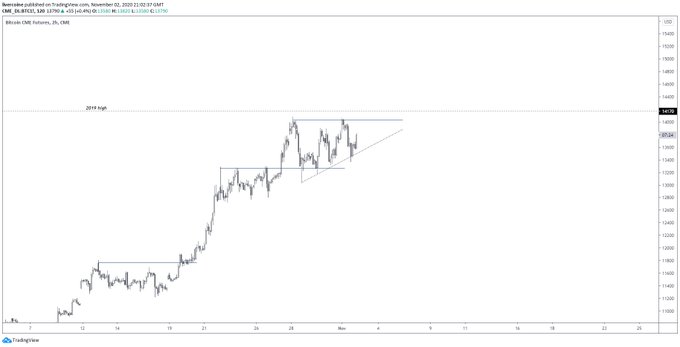
Analyst Sean Nance has noted that per an indicator he uses, there has been a “significant amount of selling” in the latest leg lower. The indicator in question has printed a value the same as the one seen at the start of the Bitcoin rally in July.
While we know that this selling is what has triggered the ongoing downtrend, Nance asked “why hasn’t price fallen further.”
As aforementioned, the indicator suggests that Bitcoin is in a similar place to where it was in July in terms of selling volume.
Nance believes that this could be a sign that there are “limit buys” supporting the Bitcoin price, which in turn may lead to a move towards the upside once this ongoing leg lower cools off.
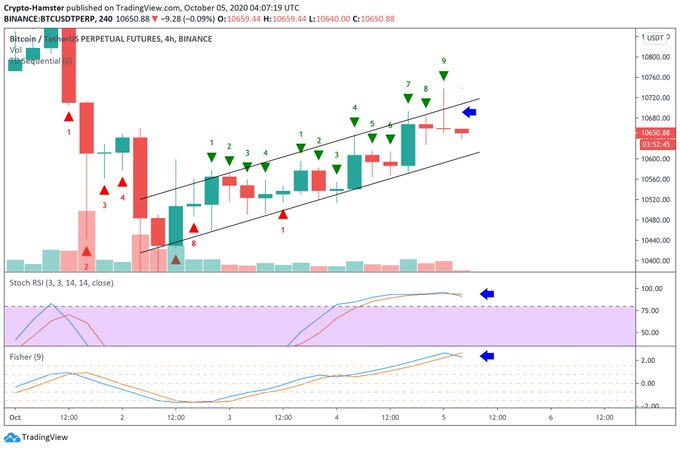
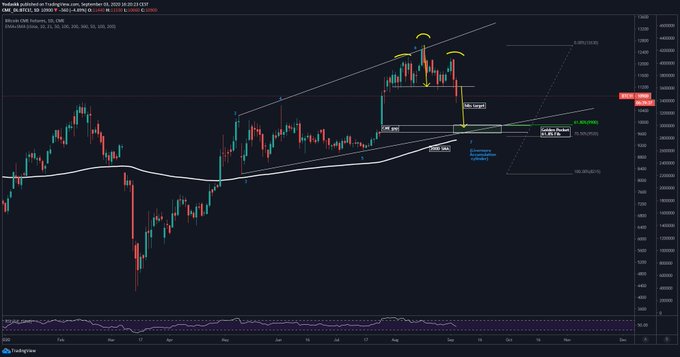
Chart of BTC's price action over the past few months with on-balance volume analysis by crypto trader Sean Nance (@seannance on Twitter). Chart from TradingVIew.com Worst Is To Come?The worst may be yet to come, though, according to a recent analysis by Bitcoin on-chain and technical analyst Willy Woo.
He explained in an August 25th analysis that on-chain metrics show a bearish reversal on the short-term is possible:
“While the longer time frame on-chain structure is bullish, we are seeing a large number of coins being moved on-chain, which usually means a reversal of direction, we just peaked in coins moving, last move was bullish, suggests next move is bearish.”
Woo explained that factoring in this, along with technical trends like chart formations and historical market cycles, there is likely to be a multi-week correction for Bitcoin towards the $10,000s before it moves into a bull market:
“Overall my interpretation of on-chain and on-exchange technicals is a 2-3 weeks of pull back, inside of larger bullish structure.”
The analyst is a long-term believer in Bitcoin that thinks the cryptocurrency will appreciate over time due to macro trends.
Featured Image from Shutterstock Price tags: xbtusd, btcusd, btcusdt Charts from TradingView.com Why Hasn't Bitcoin Fallen Further? Analyst Looks For Silver Lining Amid $700 Drop origin »Bitcoin price in Telegram @btc_price_every_hour
Bitcoin (BTC) на Currencies.ru
|
|


