2020-8-23 04:00 |
Bitcoin has finally bounced after plunging as low as $11,400 on Friday. The asset trades 2% higher in the past 24 hours as the BTC price is retesting $11,700. Bitcoin remains in a bearish state despite the ongoing recovery, according to some analysts. One noted that there is a bearish divergence suggesting BTC will fall towards $10,500. A bearish divergence is when an asset moves higher in price while an indicator (often trend indicator) moves lower. Bitcoin must hold $10,500 to remain in its medium-term bull trend, analysts say. Bitcoin Is Likely to Test $10,500 in the Near Future: Technicals
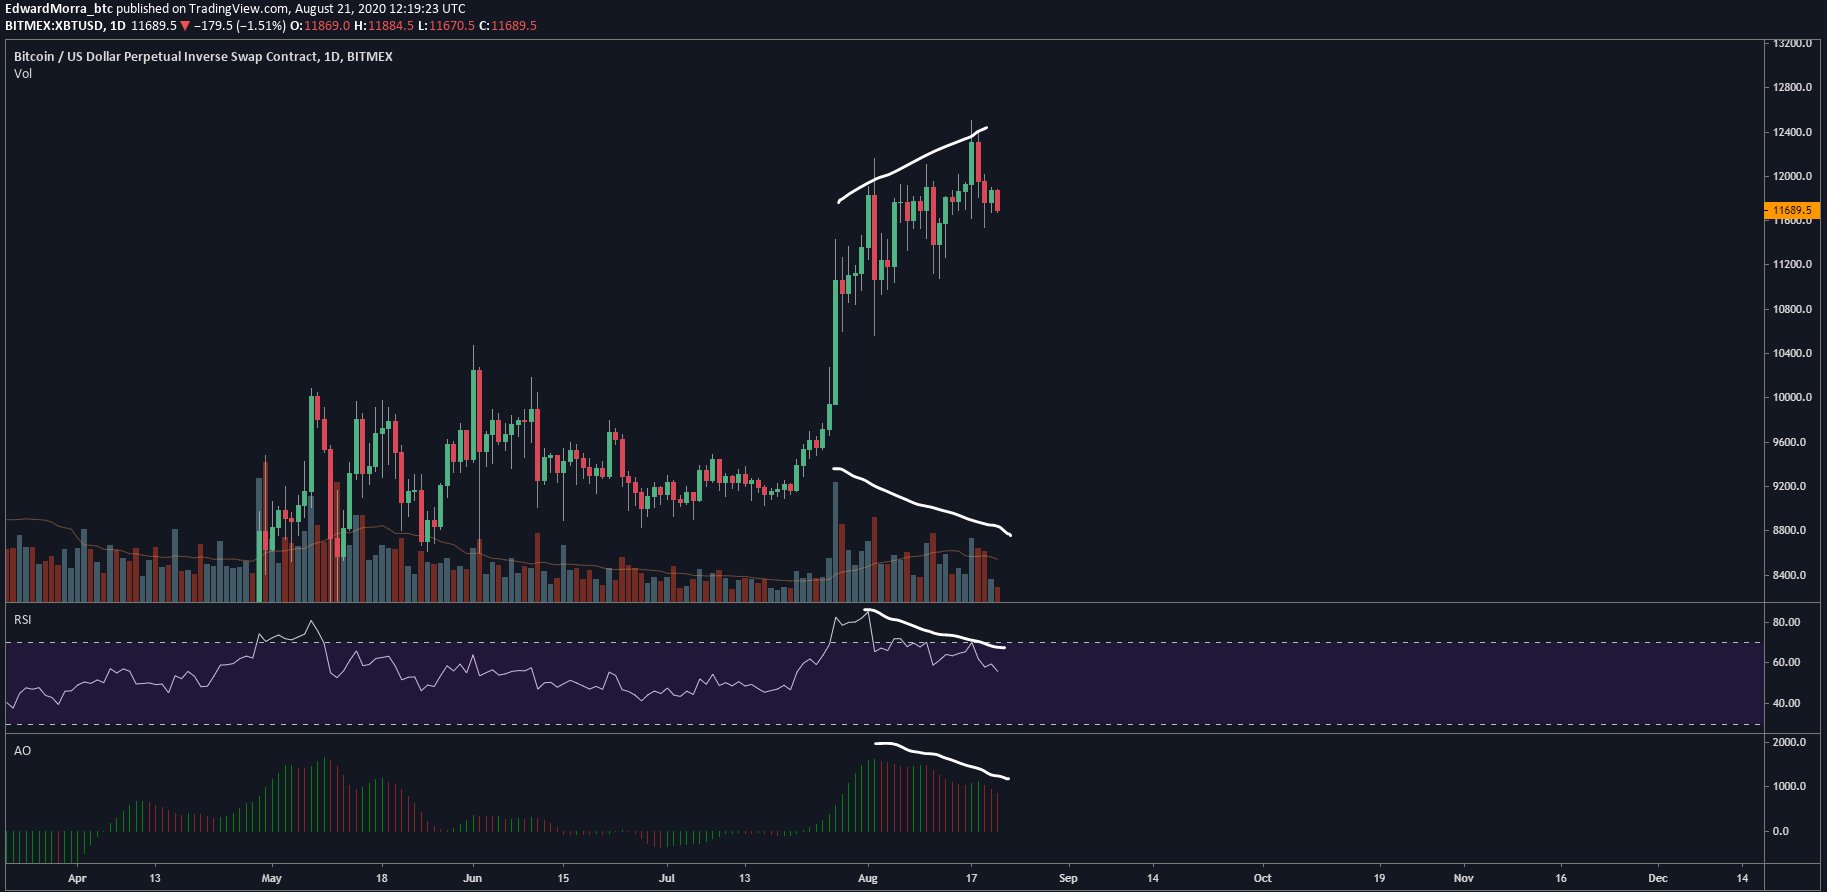
Bitcoin is primed to move towards $10,500 in the near term, one cryptocurrency trader said. He published the chart below on August 21st, noting the divergence that has formed between Bitcoin’s price and the relative strength index and AO indicator.
“Daily chart though, it looks really shaky. Volumes dropping, momentum fading away. Unless it closes above $12,3k and invalidates bearish divs we most likely going to mid 10k,” the trader who shared the chart remarked in reference to the divergence formed on the chart.
Chart of BTC's price action over the past few months with a divergence analysis by crypto trader "Edward Morra" (@Edwardmorra_btc on Twitter). Chart from TradingView.comBitcoin formed a similar bearish divergence at the peak of the last medium-term bull trend at the start of June. Should history repeat, the leading cryptocurrency will enter a consolidation from here, not re-enter a bear market.
Price Must Hold This Level to Maintain the UptrendBitcoin must hold $10,500 if it revisits that price region, analysts have said. This is because $10,500 is a pivotal level for Bitcoin from a technical perspective; one analyst even went as far as to say that BTC losing that region could lead to a macro retracement to the $3,000s.
“Levels to watch on $BTC if we continue dropping: $11.2-11k and $10.6k. Should these two major supports be broken then it could signal a shift in trend in the medium to long term. So far $11,000 hasn’t been raided in the past few weeks,” one analyst commented on the importance of $10,500.
Chart of BTC's recent price action by crypto trader Flood (@ThinkingUSD on Twitter). Chart from TradingView.comThe reason why analysts have assigned such importance to $10,500 is two-fold:
The Kijun level of the one-day Ichimoku Cloud currently sits at that level. The Kijun is a level that assets normally hold in uptrends as per the Ichimoku Cloud. $10,500 was a level that three separate Bitcoin rallies topped at over the past 12 months. Photo by Sam Moqadam on Unsplash Price tags: xbtusd, btcusd, btcusdt Charts from TradingView.com Why Bitcoin Is "Most Likely" Going to Test $10,500 in the Coming Days origin »Bitcoin price in Telegram @btc_price_every_hour
Bitcoin (BTC) на Currencies.ru
|
|


