2022-10-29 02:55 |
Bitcoin is slowly losing its grip on the bullish momentum it had for the last couple of days, declining by 2.7% over the last 24 hours.
At press time, according to tracking from Coingecko, the alpha crypto is trading at $20,392 and is once again showing a little sign of retreat in the past few hours.
Bitcoin struggles to break past the $20,500 marker Despite bull run, BTC failed to enter the top 10 list of Galaxy Score LTC leaves Bitcoin behind after cracking the LunarCrash’s metric listAt times like these, the largest cryptocurrency in terms of market capitalization seems vulnerable and can be outperformed even by some of the lesser known altcoins like Litecoin (LTC).
Such was the case with Galaxy Score – a metric provided by LunarCrush designed to provide help in understanding crypto movement through extensive data analysis.
Litecoin managed to enter the top 10 list while Bitcoin was left out – a development that came as a surprise.
Bitcoin Misses Out On A Potential Bullish SignalWhile Galaxy Score is not a dominant and prominent indicator that can determine the trajectory of a crypto asset’s price movement, being included in its top list usually indicates a bullish rally.
Litecoin took the 6th spot in the recent ranking, coming behind Collie Inu, Flux, AmpliFi, Neblio and Callisto Network while outranking WadzPay, OKB, SONM and Ambrosus.
Meanwhile, Bitcoin wasn’t included on the list despite its massive surge and undeniable popularity.
LTC also racks up another positive development as it was listed by CeFi and DeFi platform Blockbank. This will help new investors to enter the Litecoin community as well as increase the asset’s reach.
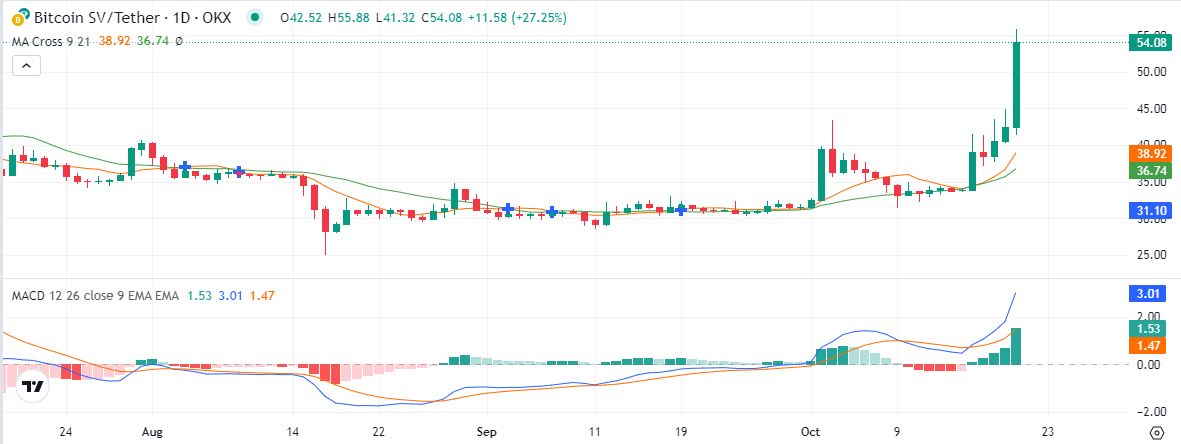
However, according to latest data from Coingecko, LTC is trading at $53.78 and while it has been down by 4.1% over the last day, it is still up by 5% both on its weekly and biweekly charts.
Litecoin Headed Towards Another Upward MovementDespite the price dump that Litecoin experienced over the last 24 hours, its technical indicators are hinting at a northbound movement that will help the asset increase its value in the coming days.
Source: TradingViewIn particular, its Relative Strength Index (RSI) and Chaikin Money Flow (FLOW) are both positioned above the neutral zone, indicating a bullish rally is on the horizon for the crypto.
Furthermore, Litecoin’s 20-day Exponential Moving Average (EMA) is rapidly heading towards the 50-day EMA, confirming the positive thesis.
Lastly, the Bollinger Band revealed that the asset’s spot trading price is on its way to the high volatility zone.
All of these and other market indicators are giving investors a reason to be optimistic as a continued price surge for LTC is likely to happen.
If this happens, Litecoin will also prove that its gains over the last few days are not merely due to the crypto market rally fuelled by the likes of Bitcoin and Ethereum.
LTC total market cap at $3.8 billion on the daily chart | Featured image from ITNext, Chart: TradingView.com Disclaimer: The analysis is based on the author's personal knowledge and should not be construed as investment advice. origin »Eight Hours (EHRT) на Currencies.ru
|
|


