2020-3-12 16:25 |
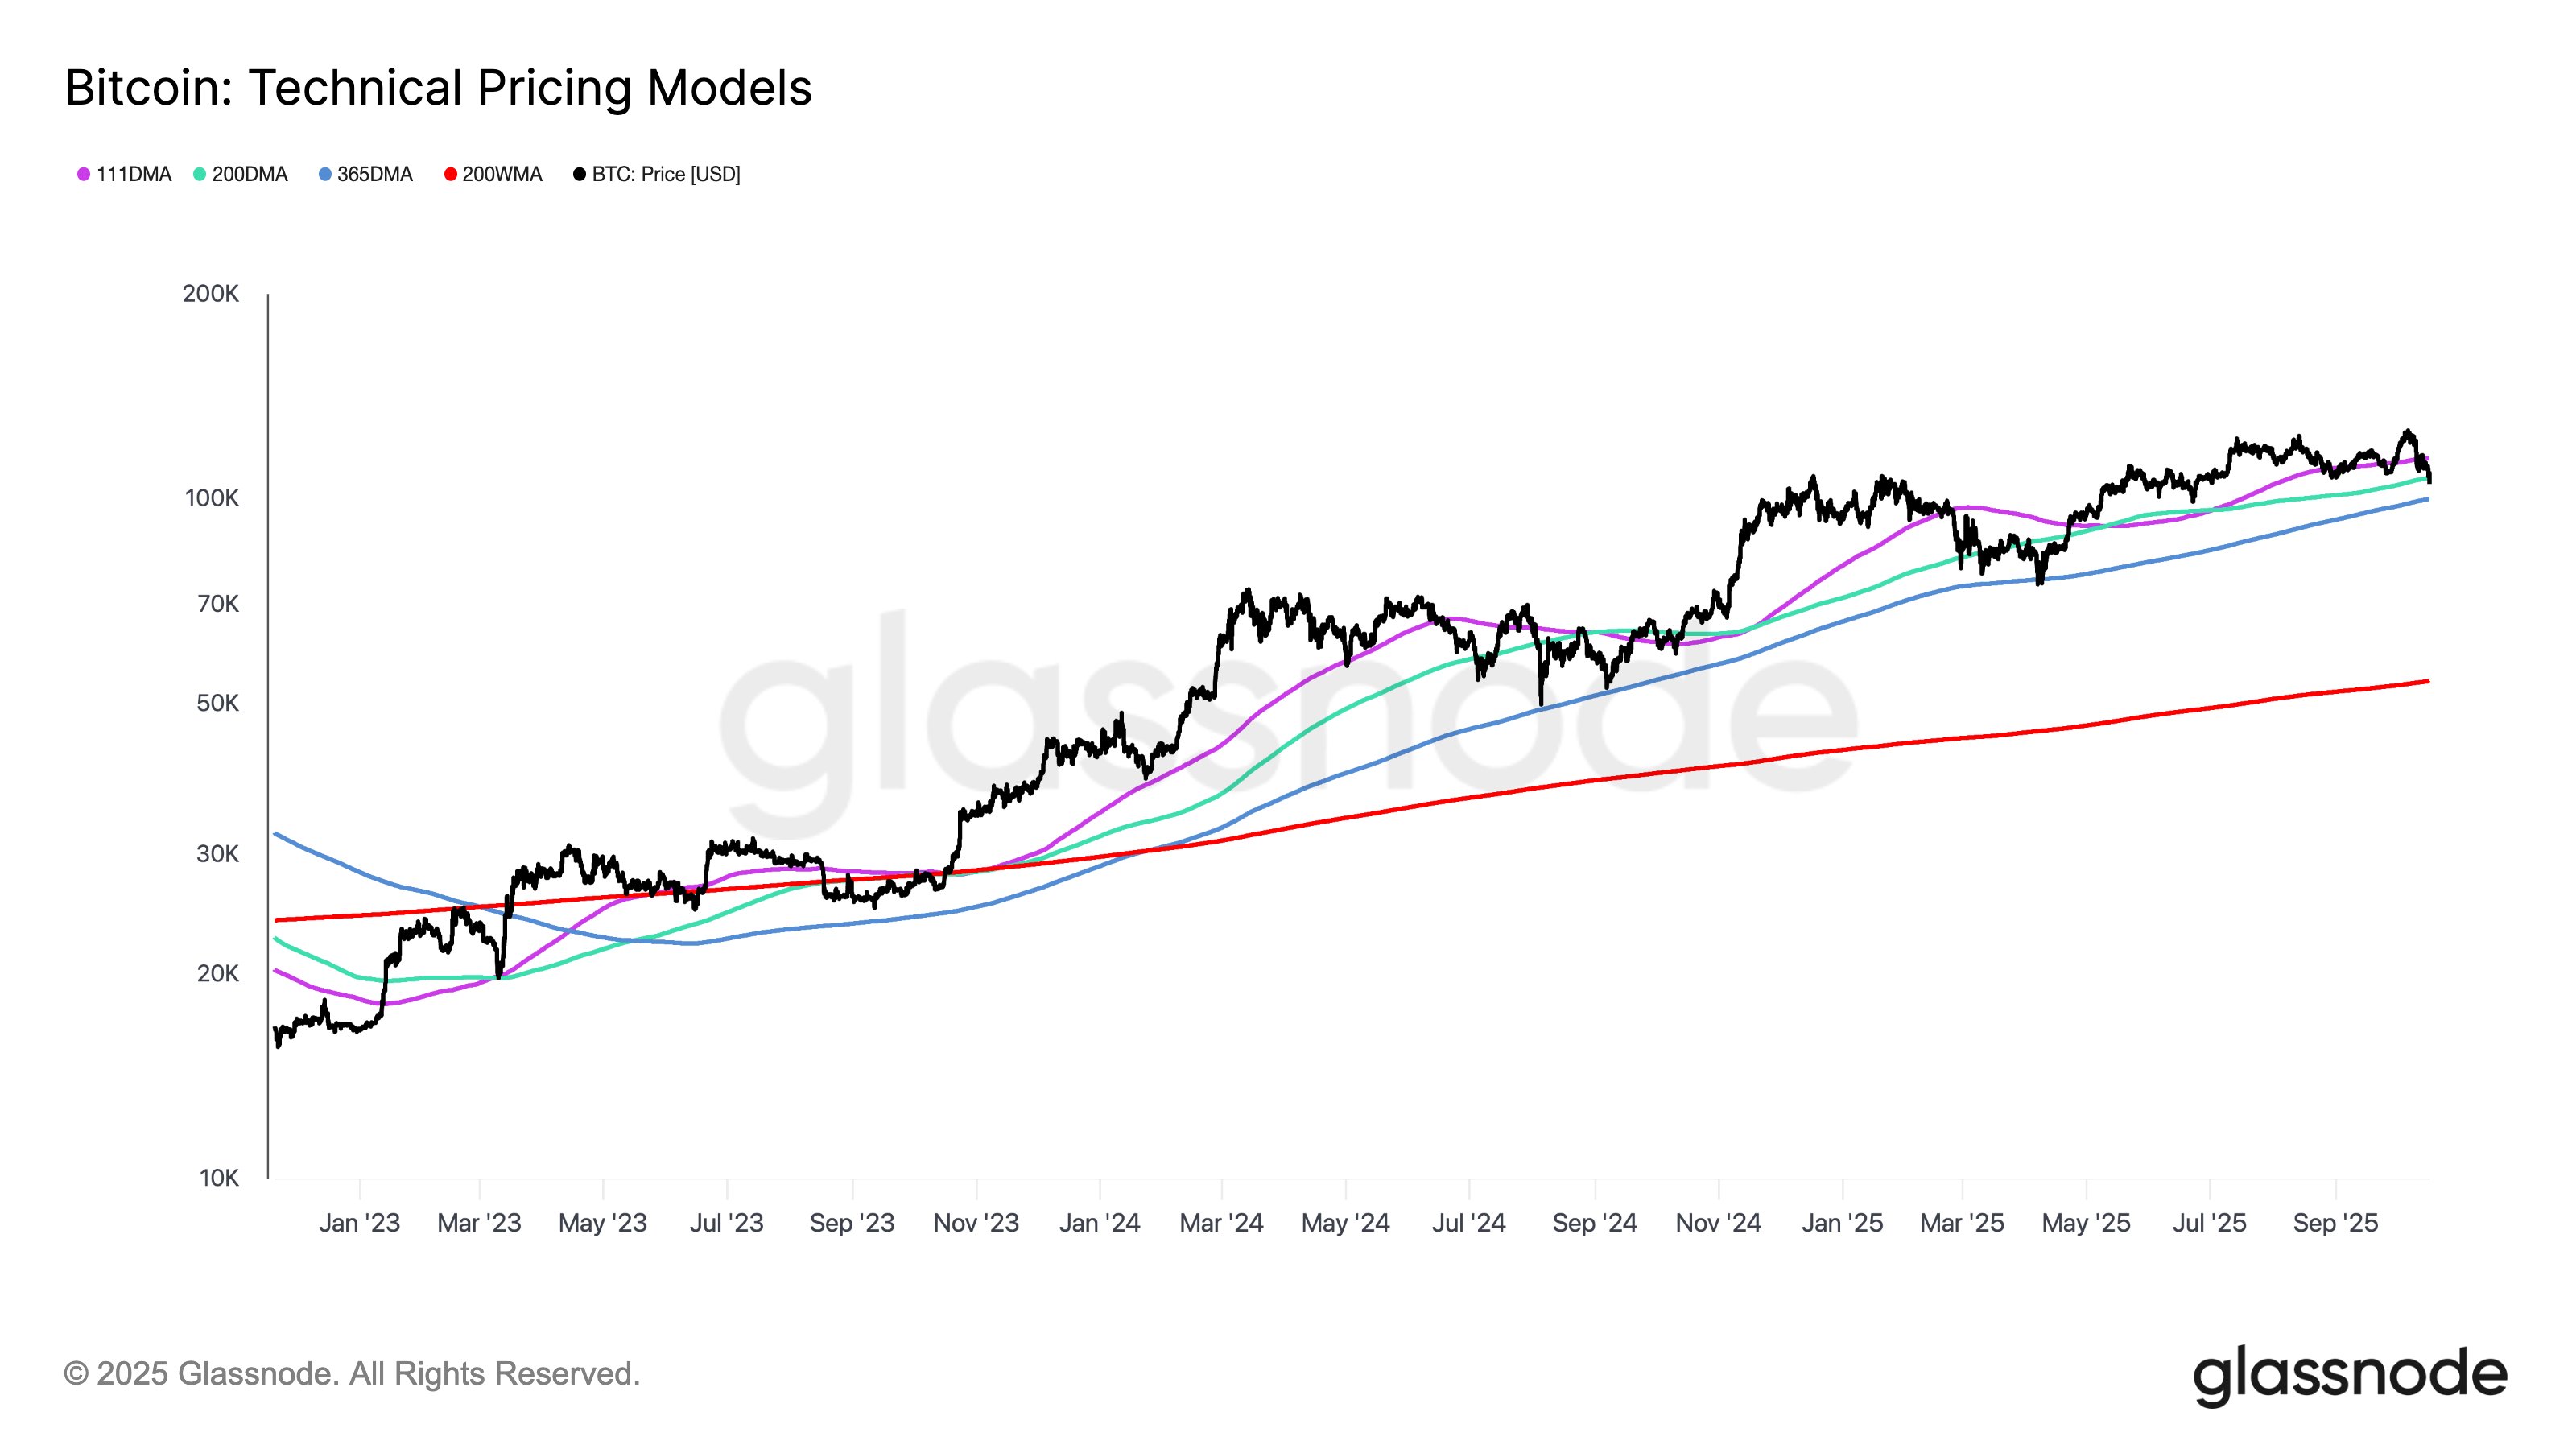
On March 12, the BTC price underwent a rapid decrease that caused it to drop from $7,400 to $5,600 in less than an hour. This also caused the price to validate its 200-week moving average (MA).
Bitcoin (BTC) Price Highlights The Bitcoin price has reached its 200-week moving average. It is trading right at the logarithmic support line. Comparisons to previous cycles suggest the price is close to a bottom.Well-known trader @Davthewave posted a Bitcoin chart that shows the price bouncing at a long-term support line. In addition, he stated that this decrease is right at the 0.5 Fib level of the previous upward move.
pic.twitter.com/6z5nvVeVGn
— dave the wave (@davthewave) March 12, 2020
Has BTC reached a long-term bottom, or are there further decreases in store? Continue reading below if you are interested in finding out.
Logarithmic SupportThe support line outlined in the tweet is a curved support line drawn in the logarithmic chart that has been in place since BTC’s inception. In addition, the 200-week moving average is outlined in black in the graph below.
The price has validated both the support line and the MA numerous times, the prior three being on:
August 2015 December 2018 January 2019The current weekly candlestick is below this support line and has touched the MA. However, there are four more days until the weekly candlestick closes, so we cannot yet state that the price has broken down below this line.
In August 2015, the price decreased way below this level only to bounce afterward and close the week slightly above the MA.
The weekly RSI can be helpful in determining where the current price level is in regards to previous cycles. It has been oversold on only two occasions, January 2015 and December 2018.
The current decrease that touched the support line has occurred 455 days after the RSI bottom. Interestingly, the price also touched the support line 455 days after the January 2015 bottom and created a very long lower wick.
As for the vertical lines, they represent the halvening dates. The proximity to halvening is another similarity between these two cycles and suggests that this is probably a bottom.
Therefore, the most probable move from here is a price increase that would cause a weekly close above $6,000 and the ascending support line.
To conclude, the BTC price has rapidly decreased and reached both a long-term support line and moving average (MA). The price is expected to bounce from this level and reach a weekly close above this support line.
The post Where Will the Bitcoin Price Make a Bottom? appeared first on BeInCrypto.
origin »Bitcoin (BTC) на Currencies.ru
|
|


