2026-5-6 16:36 |
NVIDIA stock heads into May trading 8% below its April 27 high of $216.87, but the bull flag pattern that has formed off the pullback is sitting on firm support.
The 20-day EMA is holding. The Chaikin Money Flow indicator is signaling continued institutional accumulation. Put-call ratios remain on the bullish side. And analyst price targets keep rising ahead of the May 20 earnings print. The correction has happened, but the structural bullish thesis has not broken.
Nvidia Price Chart in April 2026. Source: Google Finance Nvidia Stock Shows a Bull Flag After April HighsNvidia stock (NASDAQ: NVDA) peaked at $216.87 on April 27, 2026, completing a 32% rally off the late-March low of $164.11. That run created the flagpole. The eight trading sessions since the peak have created the flag.
Want more token insights like this? Sign up for Editor Harsh Notariya’s Daily Crypto Newsletter here.
The pullback structure is a textbook bull flag. Price has been confined within a tight descending channel since April 27. The May 4 close at $198.48 sits at the lower boundary of the channel, which is also where the 20-day EMA (exponential moving average) has provided exact support.
An exponential moving average (EMA) is a trend line that gives more weight to recent prices, making it respond more quickly to new price action than a simple moving average.
The pattern matters because of what it represents. A bull flag is a continuation pattern, not a reversal pattern. It forms after a strong directional move and represents a brief consolidation before the prior trend resumes.
The base case is upward continuation. The risk case is a breakdown below the flag boundary, which would weaken the pattern.
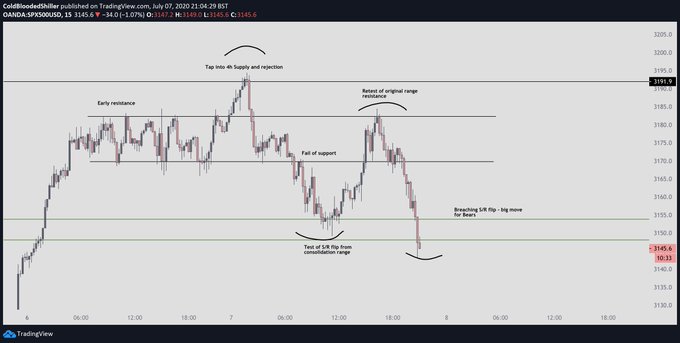
Nvidia Stock Bull Flag: TradingViewThe flag’s lower boundary aligns closely with the 20-day EMA, the same line that held during NVIDIA’s late-March correction before the April rally.
The last time NVIDIA cleanly lost the 20-day EMA, in mid-March, the stock dropped 11% before finding a bottom at $164.11. That precedent is why this support test matters.
The 8% correction has happened. The flag is forming. The next move depends on whether the 20-day EMA holds or fails.
Institutional Flows and Bullish Positioning Confirm the May SetupThe conviction behind Nvidia stock’s bull flag sits in three independent signals that all point in the same direction.
The first is the Chaikin Money Flow indicator, a proxy for institutional buying. CMF currently reads 0.34, well above the zero line that separates accumulation from distribution. A reading this high indicates sustained buying pressure across recent sessions. The institutional bid is still active.
Nvidia Stock CMF Indicator: TradingViewThe second signal is the put-call ratio. On April 27, when Nvidia stock peaked at $216.61, the put-call volume ratio was 0.38, and the open interest ratio was 0.83. That positioning was heavily bullish.
Nvidia Stock Put-Call Ratio Historical: BarchartThe volume ratio rose to 0.45 by the May 4 close at $198.48, reflecting new put activity during the pullback. But the open interest ratio actually decreased slightly from 0.83 to 0.82. The pattern is consistent with long liquidations (the reason for the correction) rather than fresh short positioning.
Nvidia Stock Put-Call Ratio Recent: BarchartThe third signal is Wall Street action. DBS raised its target from $220 to $250 on April 27, reiterating a Buy. Bernstein reiterated a Buy with a $300 target on April 17.
Bank of America reiterated a Buy on April 28. Rosenblatt holds the highest target at $325. Cantor Fitzgerald and Bernstein both sit at $300. The cluster of price targets between $250 and $325 frames the bullish consensus, with no recent downgrades or trim actions.
Stock Analyst Actions: TipRanksThe AI sector backdrop adds another tailwind. Palantir’s strong Q1 print on May 4 lifted sentiment across AI infrastructure names, with NVIDIA among the most direct beneficiaries of any acceleration in enterprise AI demand.
The May 20 earnings print is the next catalyst that tests the thesis.
Nvidia Stock Price Levels Define the Bull Flag ResolutionNVIDIA’s stock trades at $198.48, with the 20-day EMA at $198.20 acting as the critical support level. That EMA is the line that decides the bull flag’s resolution.
A daily close above $207.12, the 0.236 Fibonacci level, signals the flag’s upper boundary has broken, and the prior uptrend is resuming. Above this level, the chart faces resistance at $214.82, the 0.382 Fibonacci level, and then the April 27 peak at $216.87.
A clean break above $216.87 confirms the bull flag breakout and opens the path to $221.04 (0.5 Fibonacci), $227.27 (0.618 Fibonacci), and $236.13 (0.786 Fibonacci).
The pattern’s measured-move target sits at $273.62, with the 1.618 Fibonacci extension at $280.03 framing the stretch target.
The 2.618 Fibonacci extension at $332.79 aligns with Rosenblatt’s $325 analyst target.
Nvidia Price Analysis: TradingViewThe downside levels show what failure looks like. A daily close below $194.66 invalidates the bull flag and breaks the 20-day EMA, which would replicate the mid-March pattern that preceded an 11% drop.
Below $194.66, the path opens to the 50-day EMA at $191.13, then the 100-day EMA at $186.95 alongside a key horizontal level near $186.25. Below the $186 zone, the chart support at $171.68 comes into focus.
A break below $171.68 exposes the long-term floor at $164.11, the late-March low.
For now, the NVDA price levels are clear. A confirmed close above $207.12 opens the path toward $273.62 over the May earnings cycle. A close below $194.66 cracks the flag and exposes the path back to $186.25 or lower.
The 20-day EMA at $198.20 is the line. May’s direction depends on whether it holds.
The post What to Expect From Nvidia Stock Price in May 2026 appeared first on BeInCrypto.
origin »Bitcoin price in Telegram @btc_price_every_hour
Theresa May Coin (MAY) на Currencies.ru
|
|