2022-2-18 06:30 |
Looking at current bitcoin market values over historical percentiles to show when the market is bottomed, topped or neutral.
The below is from a recent edition of the Deep Dive, Bitcoin Magazine's premium markets newsletter. To be among the first to receive these insights and other on-chain bitcoin market analysis straight to your inbox, subscribe now.
In today’s Daily Dive, we will cover some of the key on-chain cycle indicators and what they tell us about where we are at in the market. All of the indicators today leverage a percentile analysis, looking at current values over historical percentiles, to show when indicators suggest when the market is bottomed, topped, neutral or in between.
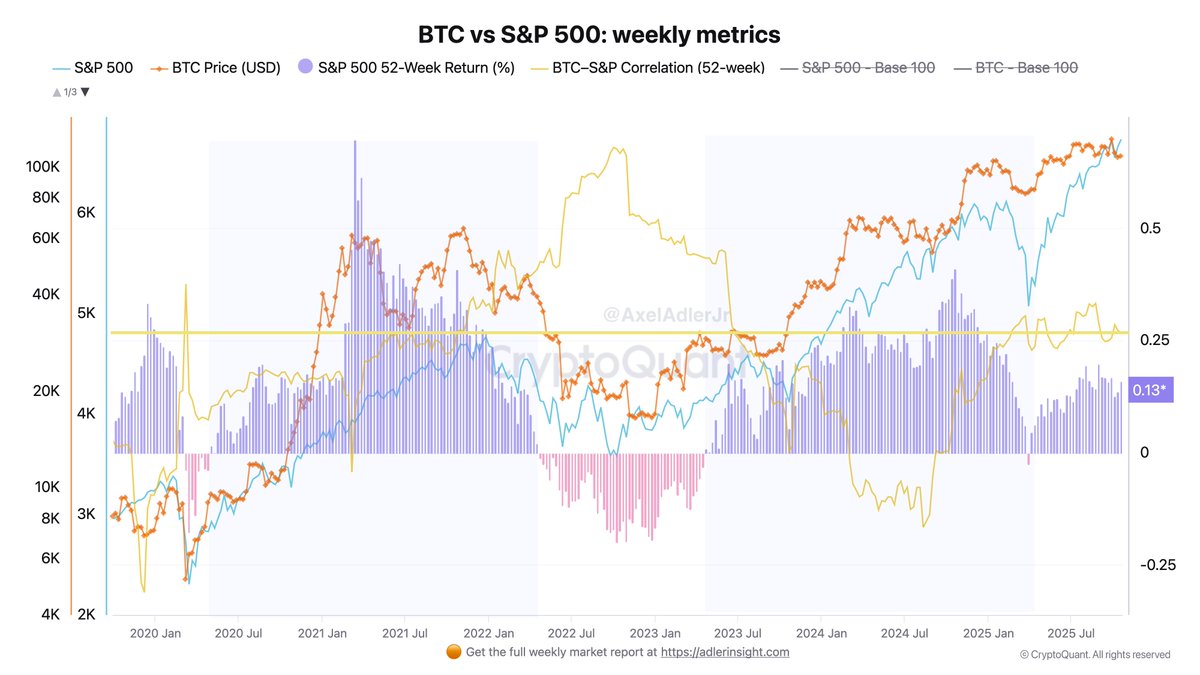
Across the approximately 20 on-chain cycle indicators we track, on-chain shows a neutral to bullish market setup. Yet, we know that on-chain, macro and derivatives all play a role in bitcoin’s growth trajectory, especially with high bitcoin risk-on equities correlations right now.
The Market Value To Realized Value Ratio (MVRV) is a metric we cover extensively as it incorporates the current state of price relative to bitcoin’s on-chain cost basis or “fair value.” The MVRV Z-Score incorporates the standard deviation of market cap to produce a more quality signal.
At the previous 2021 bitcoin highs, we didn’t see the cycle blow-off tops play out like previous cycles. But with less upside, also likely brings less extended downside. Currently, bitcoin’s MVRV Z-Score points to a neutral market state after the price has rallied from the $30,000 range multiple times. Another move down to an “over-cooled” dark green state, where the value is below its 15th percentile, looks unlikely barring a black swan sell-off type event.
The bitcoin price, weighted by MVRV Z-score The bitcoin price as an MVRV Z-score percentileA cumulative view of 90-Day Coin Days Destroyed (CDD) is another key indicator that helps show the activity of long-term holders. Although we saw a rise in coin days destroyed during the May 2021 top, we didn’t see much spending activity at all during the November 2021 top. The last few months have seen little movement in older coins moving, suggesting that most “smart money” holders are sitting tight right now.
origin »Bitcoin price in Telegram @btc_price_every_hour
Market.space (MASP) на Currencies.ru
|
|