2022-7-8 21:00 |
Crypto brokerage Voyager Digital filed for bankruptcy on July 6 and announced its restructuring plans. Voyager Token (VGX) also fell to a new all-time low and shows no signs of a bullish trend reversal.
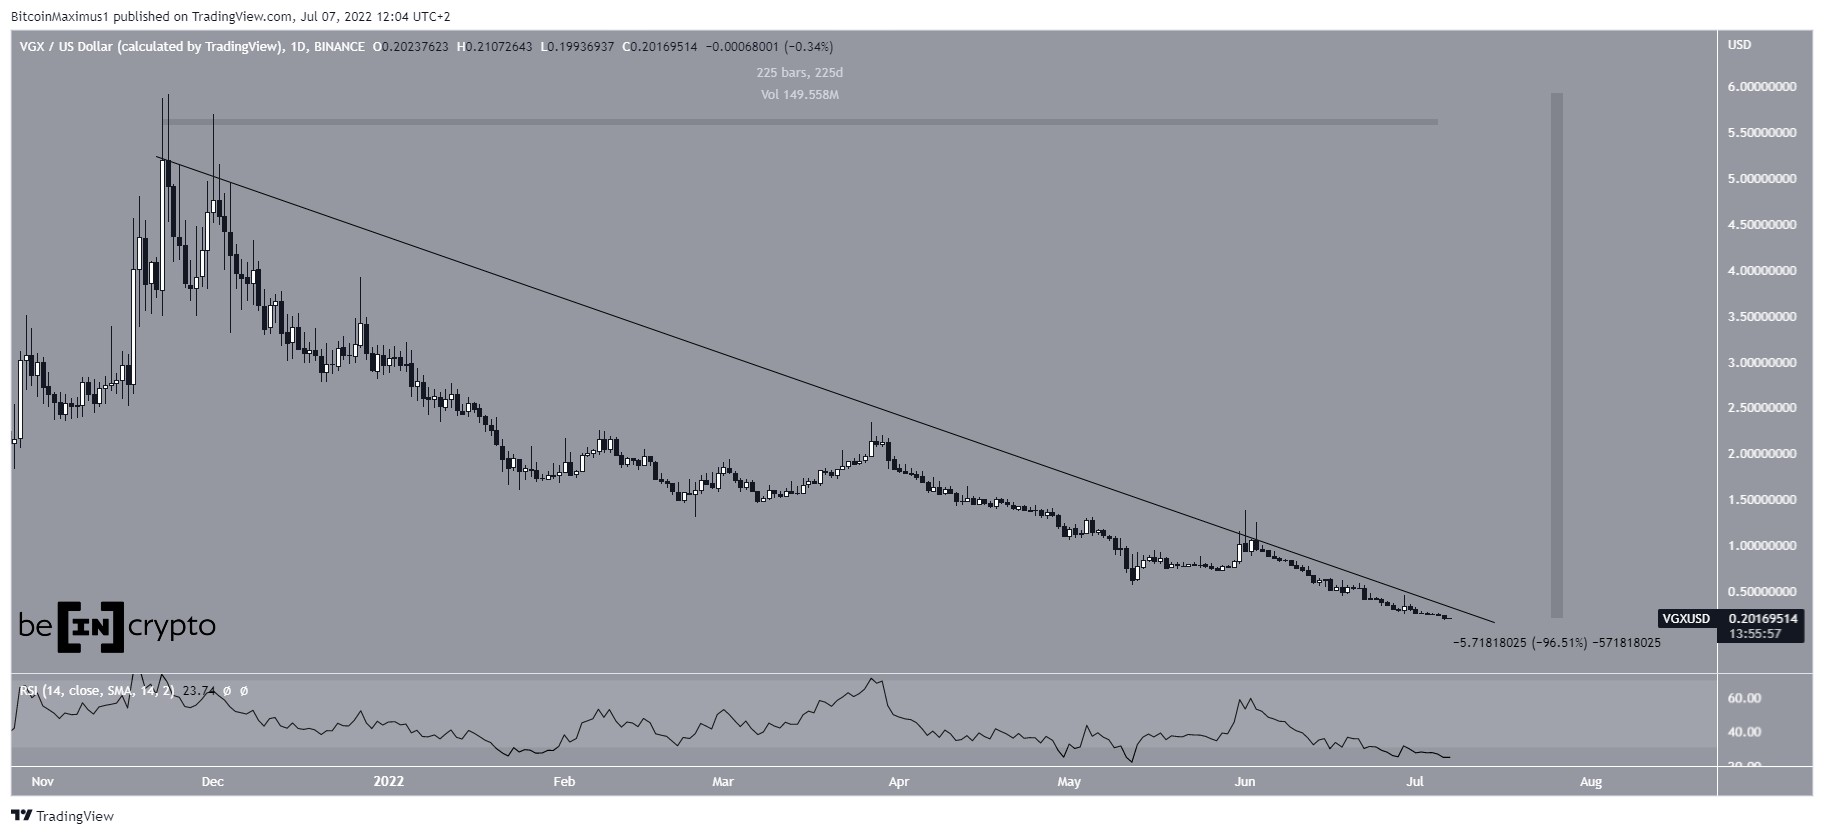
VGX has been falling since reaching an all-time high price of $5.91 on Nov 23. The downward movement has so far led to an all-time low price of $0.179 on July 6. This amounts to a decrease of 96.50%.
Throughout the decrease, the price has been falling underneath a descending resistance line, which more recently caused a rejection on June 1 (red icon). So far, the resistance line has been in place for 225 days.
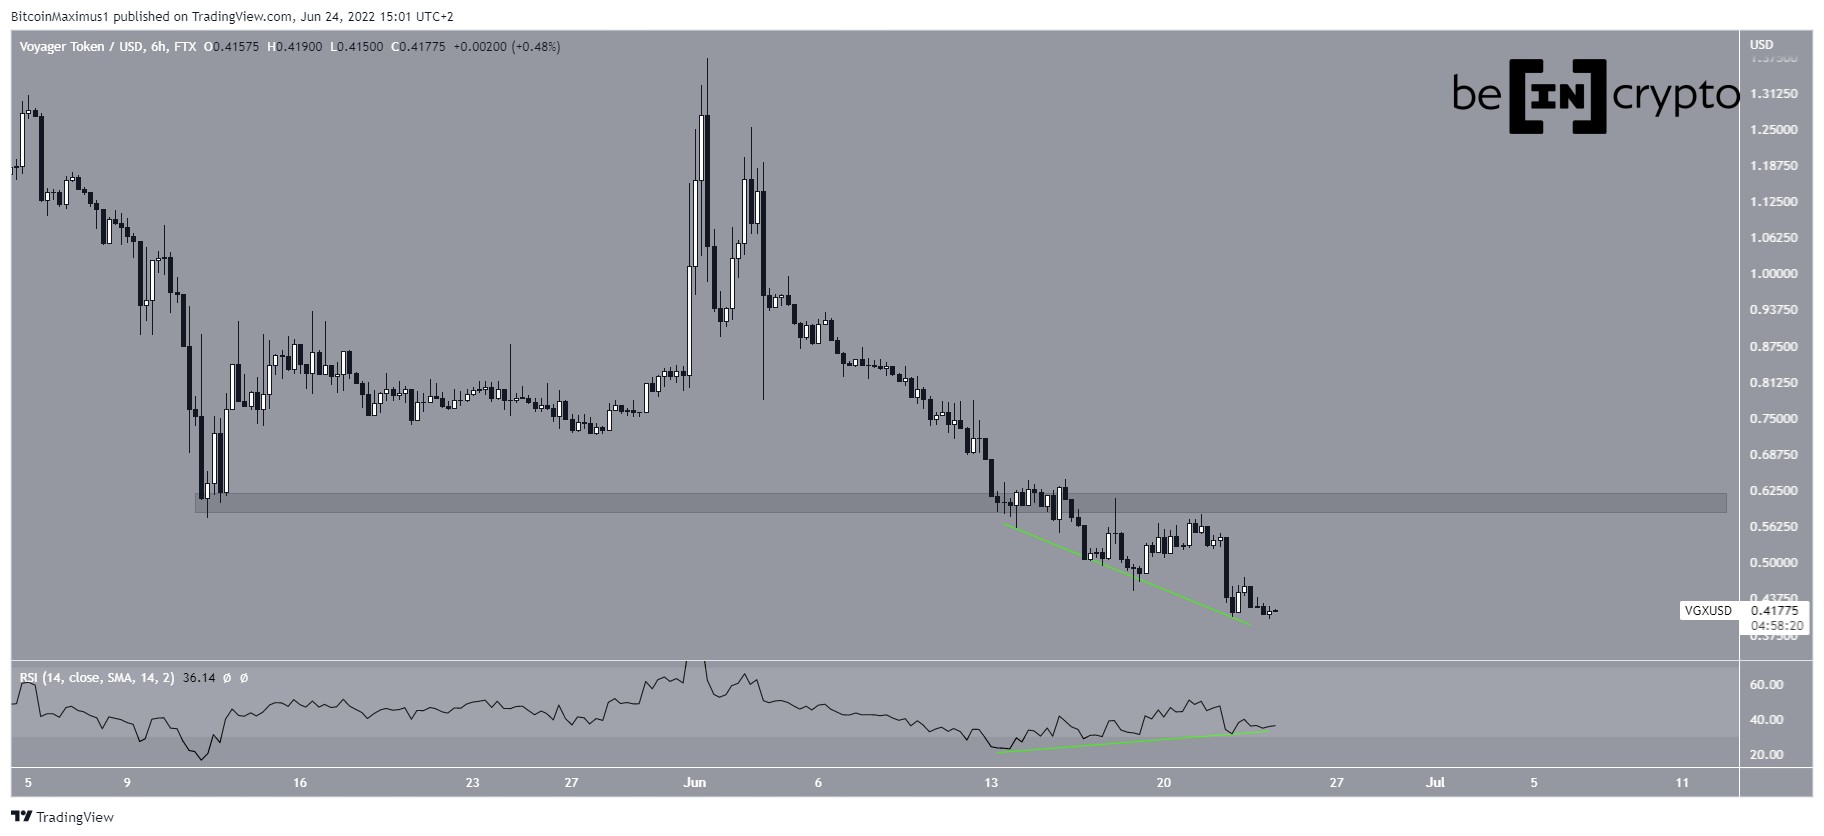
While the daily RSI is heavily oversold, there is no bullish divergence yet. As a result, there are no bullish reversal signs in place yet.
VGX/USD Chart By TradingView Short-term movementThe two-hour chart shows that VGX has been falling inside a descending parallel channel since June 14. Such channels usually contain corrective movements, which would mean that an eventual breakout is likely. Currently, the price is trading in the upper portion of the channel, after bouncing at the midline (green icon) on July 6.
However, similar to the daily timeframe, the two-hour RSI has not yet generated any bullish divergence and is following a descending resistance line.
So, technical indicators do not yet provide any bullish reversal signs.
VGX/USD Chart By TradingView VGX/BTCSimilar to the USD pair, the VGX/BTC chart fell to a new all-time low on July 6. The daily RSI is at an all-time low, but has not generated any bullish divergence yet.
The price has been falling underneath a descending resistance line since July 1. Until it breaks out from this line, the trend cannot be considered bullish.
VGX/BTC Chart By TradingViewFor Be[in]Crypto’s latest bitcoin (BTC) analysis, click here
The post Voyager Token (VGX) Falls to New All-Time Low Amid Restructuring Plans appeared first on BeInCrypto.
origin »Bitcoin price in Telegram @btc_price_every_hour
Time New Bank (TNB) на Currencies.ru
|
|


