2026-1-17 22:30 |
The PUMP price has been quietly pushing higher for weeks, and now it’s reaching a level where the chart starts to matter a lot more.
Crypto trader DonnieBTC described the latest move as a “perfect retest,” noting that PUMP has been grinding higher for nearly a month and still stands out as one of the stronger coins around.
Analyst Aman picked up on the same theme, pointing out that after a solid weekly gain, the PUMP price is now pressing into the $0.0030 resistance. If that level gives way, the path toward $0.0035 and beyond starts to come into view.
That really sums things up. The trend looks strong, but everything hinges on how price behaves around $0.0030.
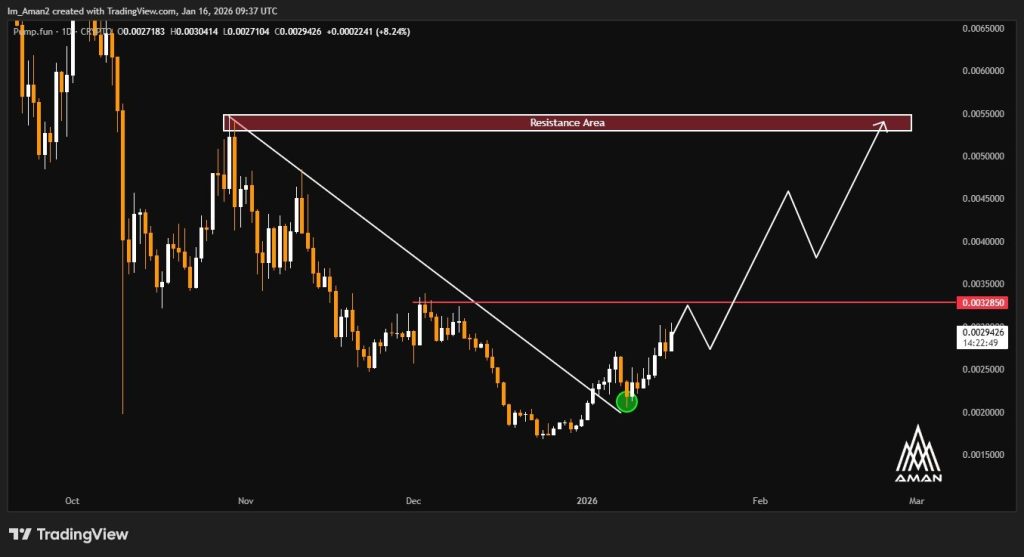
The PUMP Daily Chart Explains The Reset and Why This Level MattersLooking at the daily chart shared by Aman, it’s clear that the PUMP price is coming out of a long downtrend that followed the late-2025 selloff. What stands out now is the change in behavior near the lows.
The price stopped sliding, built a base, and slowly started turning higher. That shift is often the first sign that sellers are losing control.
Source: X/@Im_Aman2There’s also a clear pivot zone around $0.003285 that stands out on the chart. This level lines up with earlier supply and acts as the first serious test above current prices.
If the PUMP price can clear $0.0030 and start pushing into that area, the move begins to look less like a bounce and more like a continuation. Beyond that, there’s a wider resistance band closer to the mid-$0.005 range, but that’s more of a longer-term conversation.
Lower Timeframes Show Why Traders Like This SetupOn the 2-hour chart shared by Donnie, it’s easier to see why traders are calling this a clean retest.
The PUMP price broke higher, pulled back into the prior breakout zone around the mid-$0.0027 area, and found support. That same zone has now flipped from resistance into support, which is usually what you want to see in a healthy trend.
Source: X/@DonnieBitcoinThere’s also a rising trendline underneath price, acting as a guide for the move. As long as the PUMP price keeps respecting that trendline and holds above the $0.0027 area, pullbacks look more like pauses than signs of trouble.
The next supply zone sits near $0.0032, which fits with the idea that $0.0030 is the gateway and $0.0032 to $0.0033 is the next hurdle.
Read Also: VanEck Predicts the Gold Price If the Dollar Loses Reserve Status
What Comes Next for The PUMP PriceFrom here, the roadmap is fairly straightforward. If the PUMP price can flip $0.0030 into support, buyers likely stay in control and the $0.0032–$0.0033 zone becomes the next area to challenge. A clean move through that region would make targets around $0.0035 feel more realistic.
If price gets rejected at $0.0030 and slips back below the $0.0027 support, the move probably cools off and turns into consolidation. For now, though, the trend is still pointing higher, and the PUMP price continues to trade like a relative-strength leader that’s forcing the market to keep watching.
Subscribe to our YouTube channel for daily crypto updates, market insights, and expert analysis.
The post This Trader Says Pump.fun (PUMP) Is “One of the Strongest Coins” – Here’s Why appeared first on CaptainAltcoin.
origin »Bitcoin price in Telegram @btc_price_every_hour
Pumpanomics (PUMP) на Currencies.ru
|
|