2020-10-6 13:10 |
The Theta Network (THETA) token price broke out and reached a new all-time high on Sept 24.
The price has yet to show any clear signs of weakness and has allowed THETA to climb up another level.
THETA All-Time HighOn Sept 24, THETA broke out from the $0.585 resistance area and reached a new all-time high. Previously, the price had made two attempts at breaking out, on May 27 and Aug. 24.
The price continued to increase until it reached a high of $0.798 on Sept 30. This was an increase of around 37% relative to the breakout price level. However, it has created a lower high since then.
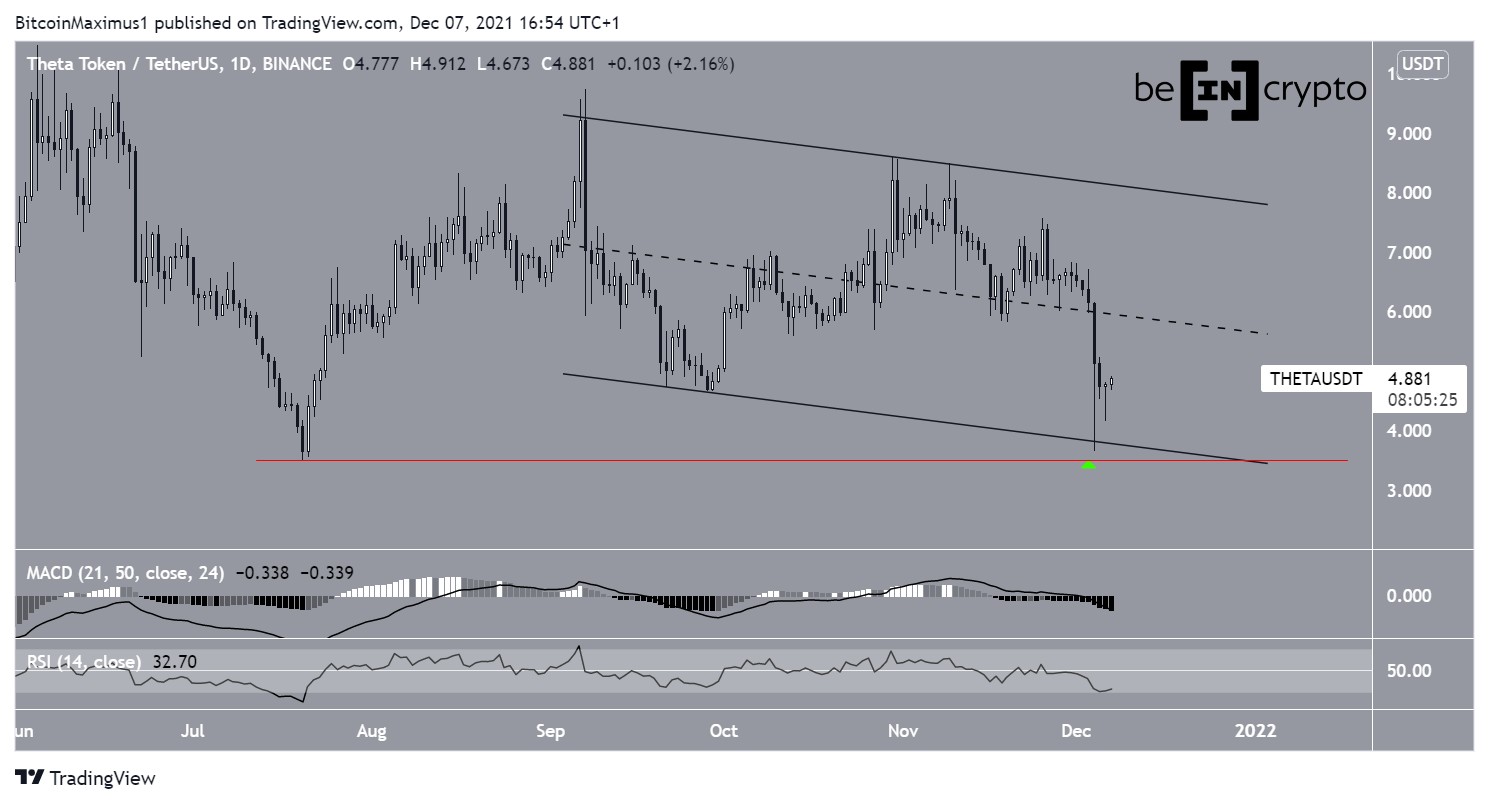
THETA Chart By TradingViewThe daily chart shows some weakness, but not enough to confirm a reversal. The lower highs have had upper wicks, a sign of selling pressure. In addition, the MACD and RSI are both decreasing.
If the price were to retrace, the $0.52-$0.56 area would be likely to offer support, as they make up the 0.5-0.618 Fib levels of the upward move that led to the breakout.
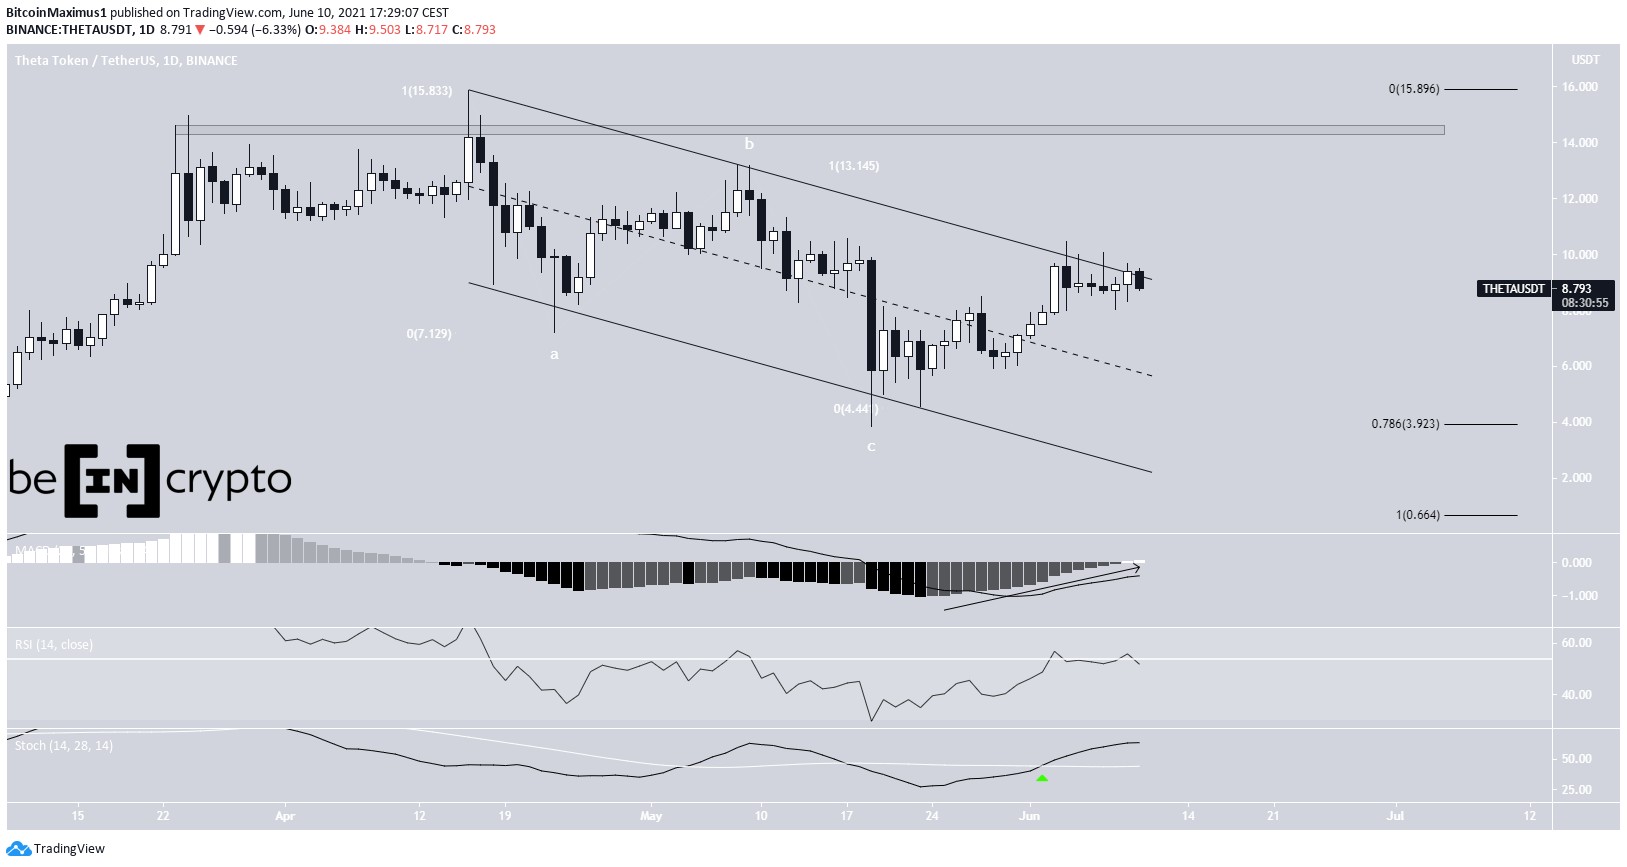
THETA Chart By TradingView Wave CountIt is likely that THETA began a bullish impulse with the June 27 low of $0.192 (shown in black below). Since then, the price has likely completed waves 1-4, and is currently in wave 5.
Considering that the price is at an all-time high, there are no resistance levels above the current price that would assist in determining the next high.
THETA Chart By TradingViewA closer look at wave 5 reveals that the price is likely in sub-wave 3 of a bullish impulse (blue). Preliminary targets for the top of the move would be found between $1.04-$1.22, the 3.61-4.61 Fib levels of wave 1.
THETA Chart By TradingView THETA/BTCCryptocurrency trader @anbessa100 outlined a THETA chart, highlighting that the price has reached yet another all-time high but looks like it will continue to climb in the short-term.
Source: TwitterThe THETA/BTC price movement is similar to its USD counterpart but has more of a bearish bias.
While the price has created a higher high instead of a lower high, both highs were combined with very long upper wicks, and the Oct 4 candlestick was a shooting star.
Furthermore, there is a significant bearish divergence in both the RSI and MACD, which are decreasing quickly.
A bearish cross in the Stochastic Oscillator would likely confirm that the trend is bearish.
A retracement could take the price towards 5,800 satoshis.
THETA Chart By TradingViewTo conclude, while the THETA/USD price could continue to increase, it is possible that THETA/BTC has reached a short or medium-term top.
For BeInCrypto’s Bitcoin analysis, click here!
Disclaimer: Cryptocurrency trading carries a high level of risk and may not be suitable for all investors. The views expressed in this article do not reflect those of BeInCrypto.
The post THETA Tacks on Nearly 40% Since Previous All-Time High appeared first on BeInCrypto.
origin »Bitcoin price in Telegram @btc_price_every_hour
Theta Token (THETA) на Currencies.ru
|
|