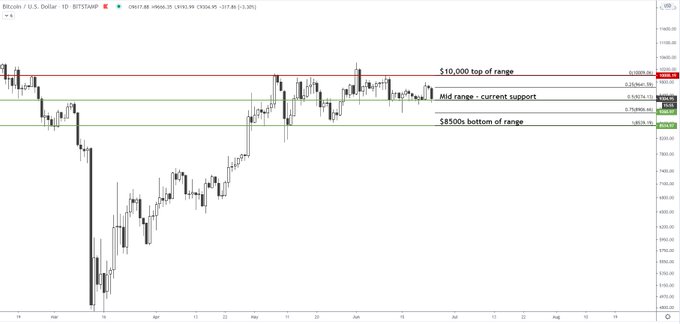
Bitcoin is finally rallying after weeks of flatlining in the low-$9,000s and high-$8,000s. As of this article’s writing, the asset trades for $9,750 — the highest price in about a month.
Volatility remains low on a macro scale, according to analysts and volatility indicators. This indicates the asset will soon see a strong breakout.
A senior analyst at Into The Block, a blockchain analytics and data firm, says there are signs that this breakout will be a bullish one.
From a macro perspective, Bitcoin remains in between a rock and a hard place despite its rally towards $10,000. The asset remains below the $10,000-10,500 macro resistance yet still above the $8,500-8,800 support that would result in another downtrend if it is broken below.
Yet analysts are observing that multiple metrics indicate Bitcoin has room to move higher.
Bitcoin Has Room to Rally, Predict Metrics
According to Lucas Outumuro, a senior analyst at Into The Block,”@intotheblock on-chain and derivatives indicators signal bullish momentum building up.”
Outumuro specifically cited three indicators, which are as follows:
The total number of Bitcoin addresses with coins in them has recently reached a new all-time high “after stagnating for three months.” The metric has reached approximately 30.96 million addresses.
“Bitcoin’s proposition as a store of value is strengthening as the number of long-term investors (hodlers) has been steadily increasing all year.” More than 62% of all BTC in circulation has now been held for a year or more. This is crucial for the bull case as the last time this much HODLing was seen, the market began the rally from $1,000 to $20,000 in a year.
Bitcoin’s derivatives open interest has surpassed a new all-time high, suggesting a potential increase in institutional investor demand/volume. As Outumuro wrote: “The total open interest in main perpetual swaps contracts surpassed $2.50 billion for the first time. As Bitcoin’s price has increased 5% this week, perpetual swaps open interest has grown significantly more (13%) pointing to the likelihood of institutional investors going long.”
Bitcoin's proposition as a store of value is strengthening as the number of long-term investors (hodlers) has been steadily increasing all year pic.twitter.com/Z2LZIqs0ri
— Lucas Outumuro (@LucasOutumuro) July 25, 2020
This comes shortly after Ki Young Ju, the CEO of Crypto Quant, mentioned three other on-chain metrics signaling Bitcoin is a “BUY” at the moment.
Ethereum, the Trailblazer of the Bull Run?
While Bitcoin’s recent gains and momentum has been impressive, BTC is strongly underperforming Ethereum. The second-largest cryptocurrency is up approximately 25% in the past five days alone, having benefited from an influx in the adoption of DeFi.
Analysts say that this discrepancy between Bitcoin and Ethereum suggests the former will eventually rally. After all, on multiple occasions over recent years, ETH has led BTC on pivotal breakouts.
Whether or not Bitcoin will one-to-one track Ethereum, though, remains to be seen.
Featured Image from Shutterstock
Price tags: xbtusd, btcusd, btcusdt
Charts from TradingView.com
These 3 Metrics Suggest Bitcoin Is Building Up Bullish Momentum origin »
While Bitcoin has seen its fair share of short-term volatility, on a macro scale the cryptocurrency is still consolidating. The below chart from Blockroots founder Josh Rager, a crypto trader, displays this well.
Despite relatively high volatility over the past 24 hours, Bitcoin continues to remain anchored in the mid-$9,000s. On a slightly longer time scale, it appears that the alpha-crypto has been consolidating sideways in a roughly $1,500 range since early May 2020.
Since the block reward halving on Monday, the Bitcoin market has entered somewhat of a lull, with the asset trading in the high-$8,000s with little volatility ever since the event. This price action — or lack thereof — has brought the cryptocurrency into “no man’s land,” according to one popular crypto trader pointing to the chart below.
Over the past week, Bitcoin has found itself flatlining, establishing a tight range in the low-$7,000s as volume tapers off. This consolidation has forced the Bollinger Bands, a moving average-based technical analysis tool often used by traders looking for more information about trading ranges and volatility, for Bitcoin to reach extremely tight levels, implying that.
Over the past week, Bitcoin has found itself flatlining, establishing a tight range in the low-$7,000s as volume tapers off. This consolidation has forced the Bollinger Bands, a technical analysis tool often used by traders looking for more information about trading ranges and volatility, for Bitcoin to reach “squeeze” levels, implying that volatility is on […]
The post Analysts expect Bitcoin to falter as price fails to break past low-$7,000s appeared first on CryptoSlate.
Once again, true to the nature of this purgatory phase in the crypto markets, Bitcoin (BTC) has been relatively flat over the past 24 hours. According to Coin Market Cap, the leading cryptocurrency is up a mere 1% in the past 24 hours — effectively nothing when you factor in this market’s often immense volatility.
Ouch. Over the past few hours, Bitcoin has finally seen some volatility play out after a multi-week lull, plunging below $7,500 after holding in the low-$8,000s for days on end. Per previous reports from NewsBTC, this move largely caught traders off guard, with there being a massive long liquidation event of over $200 million on.
A slow, grinding upward drift has been the name of the game for bitcoin’s market over the last few weeks. The upward drift is bringing us slowly to a level that was previously rejected violently:Figure 1: BTC-USD, Daily Candles, Upward DriftOur third rejection of the red resistance level shown above brought the market into a test of macro support in the mid-$3,000s.
Shortly after falling from its test of the low $4,000s, bitcoin managed to find support in the mid $3,500s. This has proven to be a relevant level over the last few months, and finding support here would be a sign of relatively strong demand:Figure 1: BTC-USD, Daily Candles, Local SupportThe high candle spread rejection following our test of the low $4,000s was an indication that we had strong levels of supply left in the market, but for the time being we are holding support.
Days and days of sideways consolidation and tightening volume has been the name of the game for the bitcoin market. A narrow range of $200 has caused a weeks worth of activity to coil and consolidate in preparation for bitcoin’s next move:Figure 1: BTC-USD, Daily Candles, Narrow RangeThe figure above shows just how narrow the range has been over the last week as the market has continued to grind out support and fail to break above overhanging resistance.
For several weeks, bitcoin has remained in a consolidating uptrend. The market hasn’t seen a new high since mid-September, but the lows have steadily gained higher and higher ground.
Once again, bitcoin finds itself precariously perched on the bottom of its macro trading range (TR). After a strong round of selling over the course of two weeks plunged the price back to the $6,000s, bitcoin began consolidating for several weeks at the bottom of the TR:Figure 1: BTC-USD, 1-Day Candles, Macro TRAs shown in the figure above, the market has interacted several times at the current price range and it has been a source of three major bullish rallies.
Bitcoin has seen a bombardment of negative publicity and volatility as it’s price plummeted from December highs of almost $20,000 per coin to where it currently sits in the mid $7,000s. However, with this extreme volatility, the trends seemed to have switched this week with many possible catalysts to blame.
A sideways market has many bitcoin investors wondering if the downward volatility has finally subsided. As stated in our previous discussion of the bitcoin market, the $6,425 support level was a very important level to hold.
Bitcoin price is consolidating above the $95,000 support zone. BTC must settle above the $100,000 level to start a fresh increase in the near term. Bitcoin started a fresh increase from the $94,200 zone.
Bitcoin price started a fresh upward move above $100,000. BTC is facing resistance at $103,000 and might aim for an upside break. Bitcoin started a decent upward move above the $100,000 zone. The price is trading below $103,200 and the 100 hourly Simple moving average.
Bitcoin price settled above the $100,500 resistance zone. BTC is consolidating gains and might aim for a fresh increase above the $105,000 zone. Bitcoin started a downside correction from the $106,800 zone.
Bitcoin price started a short-term downside correction from the $106,250 zone. BTC is consolidating above $100,000 and might aim for a fresh increase. Bitcoin started a downside correction from the $106,250 zone.