2020-8-29 07:00 |
Bitcoin is pressing higher after plunging as low as $11,150 on Thursday. The asset now trades at $11,500 as of this article’s writing. Analysts assert that the cryptocurrency remains in no man’s land in the near term. A move higher could confirm that there is more upside in the works for this nascent market. Yet it is important to note that while Bitcoin could move higher from here, a more serious correction is not off the table. Bitcoin Could Soon Move Higher, as Crazy as That May Sound
Bitcoin is printing three clear signs that it will move higher in the near future, according to a recent analysis shared by a trader.
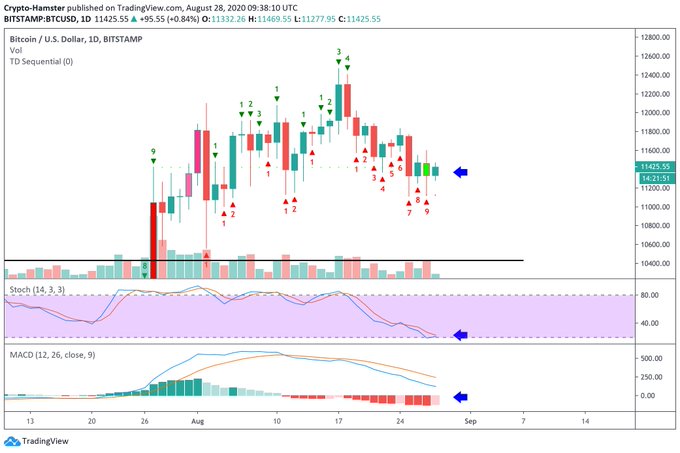
On August 28th, the trader in question shared the following three technical signals that suggest that while “It is hard to believe, [BTC] looks like it wants to go up from here…”
The signals he mentioned are as follows:
Bitcoin has formed a “buy 9” as per the Tom Demark Sequential. Such candles are often seen at the bottoms of price corrections. The Stochastic relative strength index (RSI) has formed a bullish crossover, which was last seen prior to the rally from the $9,000s to $12,500 in late July. The MACD has formed a histogram low, suggesting the worst of the sell off has passed. Chart of BTC's recent price action with analysis by crypto trader CryptoHamster (@CryptoHamsterIO on Twitter). Chart from TradingView.com A Drop Towards $9,000 Is Not Off the TableShort-term strength may be had, but Bitcoin could drop towards the $9,000s in the near future. Analysts say that this would satisfy historical patterns in this nascent market.
One trader noted that Bitcoin has historically undergone strong corrections amounting to 30-40% losses in previous bear markets. There’s a good likelihood the asset will do the same in this phase:
“$BTC #Bitcoin High Time Frame plan: Buy the previous resistance and if that fails buy the daily demand retest (see 2016-2017 corrections),” the analyst wrote in regards to BTC’s potential to retest the $9,000s before another leg higher.
Chart of BTC's macro price action with analysis by crypto trader HornHairs (@Cryptohornhairs on Twitter). Chart from TradingView.comAnother trader has discussed the potential for a correction towards the $9,000s to $10,000s before an eventual return to an uptrend. As reported by Bitcoinist previously, they said that the resistance in the high-$11,000s could trigger this:
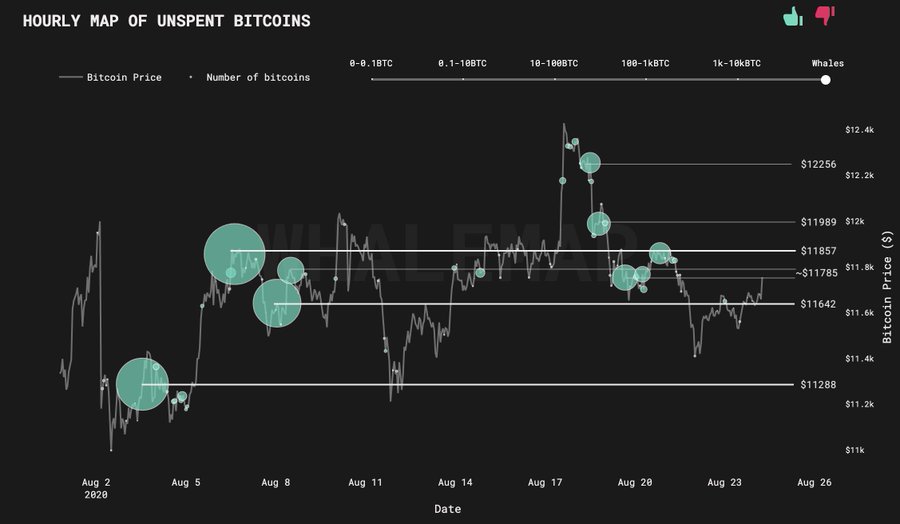
“No interest to short this market, but this is how I would envision a small potential correction. 1) Rejection from 11,700 2) Slow bleed and retest of 10,000 resistance as support 3) Successful retest and uptrend resumed…” he said while pointing to the below chart.
Image Courtesy of Edward "Teddy" Cleps, a crypto trader. Chart via TradingView.com Photo by Drew Beamer on Unsplash Price tags: xbtusd, btcusd, btcusdt Charts from TradingView.com These 3 Factors Show Bitcoin Is Poised to Press Higher After $1,000 Drop origin »Bitcoin price in Telegram @btc_price_every_hour
Bitcoin (BTC) на Currencies.ru
|
|


