2021-10-27 20:02 |
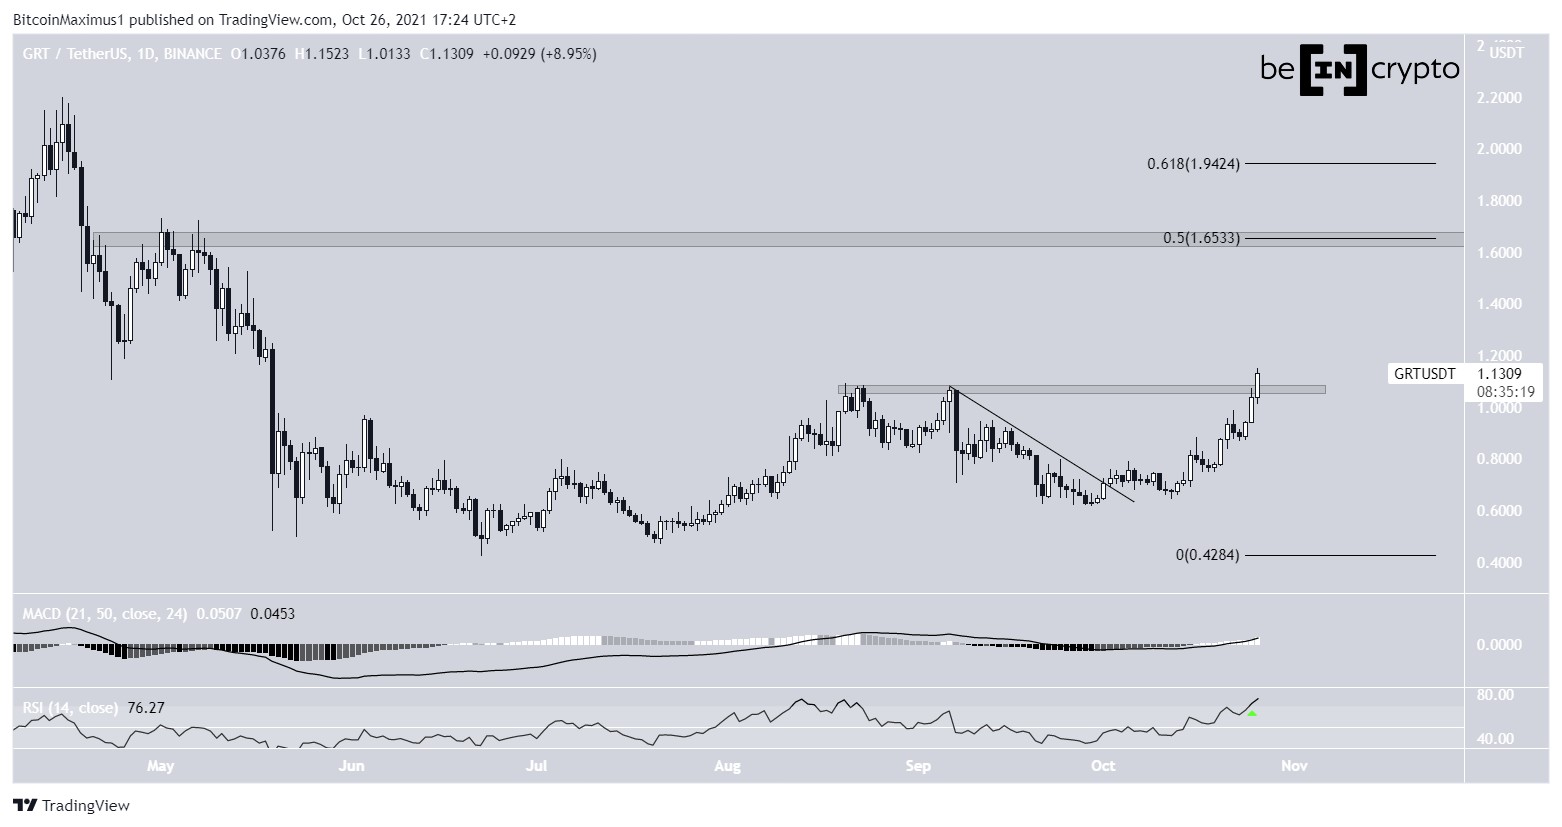
The Graph (GRT) has moved above its Sept highs, and is facing virtually no resistance until $1.65.
GRT has been moving upwards since Oct 1, when it broke out from a descending resistance line. This indicated that the correction that had spanned the entire of Sept had come to an end.
Both the RSI and MACD support the continuation of the upward movement.
The RSI, which is a momentum indicator, has been increasing since the aforementioned breakout. On Oct 23, it moved above 70. This is a strong sign of a bullish trend, even if it shows overbought conditions. The sharpest portion of an upward movement usually transpires when the RSI is above 70.
The MACD, which is created by a short- and a long-term moving average (MA), is positive and increasing. This means that the short-term trend is faster than the long-term one.
On Oct 26, GRT finally moved above its Sept highs at $1.05. Now, the next closest resistance area is at $1.65. This is the 0.5 Fib retracement resistance level and a horizontal resistance area.
Chart By TradingViewCryptocurrency trader @Incomesharks outlined a GRT chart, stating that the token is likely to see an upward movement that could take it as high as $1.65. As outlined above, the token has already initiated its upward movement and is increasing towards the $1.65 resistance area.
Source: Twitter GRT/BTCThe GRT/BTC pair is not yet as bullish as its USD counterpart, but it shows signs that often precede upward movements.
First, GRT has broken out from a long-term descending resistance line. Second, it has reclaimed the 1500 satoshi horizontal area, after initially deviating below it (red circle). This is a bullish development that often preceded upward movements.
Furthermore, the RSI has moved above 50, which as stated above, is a sign that momentum is turning bullish.
Finally, there is a bullish divergence in the MACD. This means that while the price dropped, the MACD did not, and is seen as a sign of strength.
GRT has to move above 2250 satoshis in order for the rate of increase to accelerate.
Chart By TradingViewFor BeInCrypto’s latest Bitcoin (BTC) analysis, click here.
What do you think about this subject? Write to us and tell us!
The post The Graph (GRT) Doubles in Price Over October – is There More to Come? appeared first on BeInCrypto.
origin »UniGraph (GRAPH) на Currencies.ru
|
|


