2020-12-18 17:12 |
Polkadot (DOT), ChainLink (LINK) and Dogecoin (DOGE) tokens have all traded higher since Bitcoin’s (BTC) rush to highs near $24k
Polkadot and ChainLink are among several large-cap altcoins looking to break higher after Bitcoin’s price jumped above $23,000. Meme-coin Dogecoin is also trading higher as the crypto market’s greed index soars.
DOT is up 16% this week, LINK price is up 17% and DOGE has climbed by about 25% in the week to boost bullish plans for a grand end to 2020.
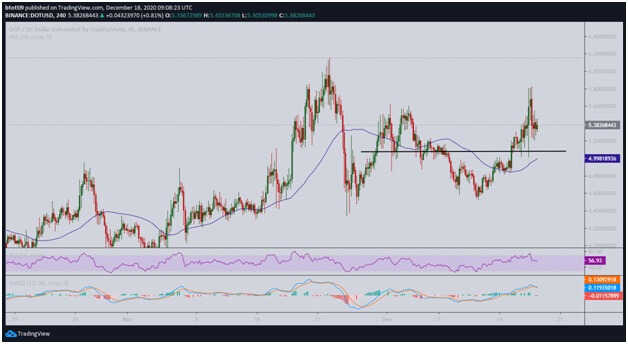
Polkadot priceDOT/USD 4-hour price chart. Source: TradingView
Polkadot rose to highs of $5.82 before hitting resistance and dropping to lows of $5.20. The rebound has so far been underwhelming for bulls given the uptick in intraday trades for most major tokens.
If buyers push DOT/USD above $5.50, breaking above overhead resistance around $6.15 could clear the path to $6.50.
Conversely, a lack of sustained upside momentum could see sellers reversing the gains. The 4-hour chart suggests the formation of a double-top pattern. The bearish signal this pattern presents could see DOT/USD drop to the 50-SMA line at $4.99.
The bearish outlook could flip positive if bulls rally above overhead resistance levels.
ChainLink priceLINK/USD price chart. Source: TradingView
LINK/USD is trading above a falling wedge pattern that informed the recent breakout to highs of $15. The rejection at the level included a dip to $12, from which bulls have rallied to currently trade around $13.85.
The recovery could see LINK price jump towards $20 if bulls clear immediate resistance around the intraday peak around $15.
The MACD and RSI on the daily chart support an uptrend and could gain further momentum if there’s an influx of buying pressure.
On the contrary, LINK/USD could drop to the key support level near the 50-day simple moving average. The 50-SMA is near $12.87.
Dogecoin priceDOGE/USD daily chart. Source: TradingView
Dogecoin price is around $0.0039 after bulls managed to breach the upper limit of the 20-day Bollinger Band. The current price action has seen prices oscillate to near the middle curve that offers major support at $0.0033. Buyers need to clear the upper squeeze curve and crack resistance at $0.0044 to avoid an immediate slip to the 50-day SMA at $0.0031.
If bears do take control short term, the 200-day SMA at $0.0029 provides a crucial support zone.
DOGE/USD 4-hour chart. Source: TradingView
On the 4-hour chart, the MACD indicator suggests a bearish divergence, with the RSI also pointing to a negative flip. The chart also shows DOGE/USD has not moved far off its recent trading range, a scenario that could see it retrace into sideways action.
The post Technical analysis: Polkadot, ChainLink and Dogecoin appeared first on Coin Journal.
origin »Dogecoin (DOGE) на Currencies.ru
|
|


