2021-3-5 06:18 |
Bitcoin price failed to stay above $50,000 and $49,000 against the US Dollar. BTC is now below the 100 hourly SMA and it is likely to continue lower towards $45,000
Bitcoin started a fresh decline below the $50,000 and $49,000 support levels. The price is now trading well below $50,000 and the 100 hourly simple moving average. There is a connecting bearish trend line forming with resistance near $49,000 on the hourly chart of the BTC/USD pair (data feed from Kraken). The pair could extend its decline towards $45,000 as long as it is below $50,000. Bitcoin Price Turns RedAfter forming a short-term top near the $52,600 level, bitcoin started a fresh decline. BTC traded below the $51,200 and $50,000 support levels to move back into a negative zone.
There was also a break below a major bullish trend line with support near $49,500 on the hourly chart of the BTC/USD pair. The pair even broke the $48,000 support level. There was a clear break below the 50% Fib retracement level of the upward wave from the $43,050 swing low to $52,650 high.
It is now trading well below $50,000 and the 100 hourly simple moving average. It seems like the bulls are trying to protect the 61.8% Fib retracement level of the upward wave from the $43,050 swing low to $52,650 high.
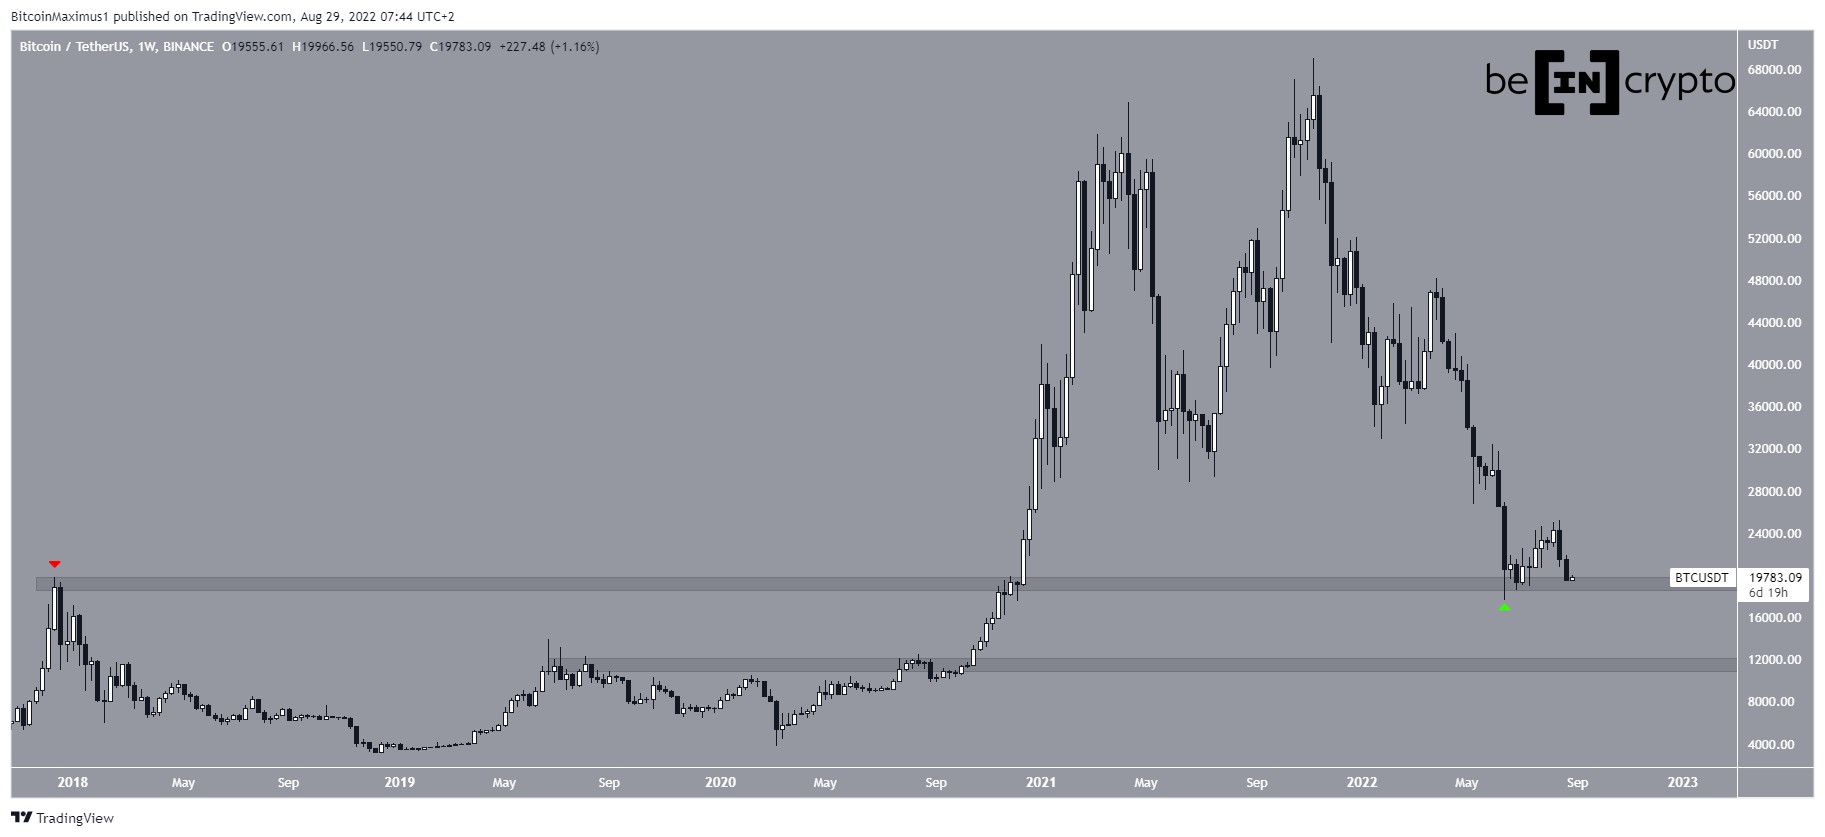
Source: BTCUSD on TradingView.comIf they fail and the price trades below $46,500, there are chances of more losses. The next key support is near the $45,000 level, below which the bears might aim a test of the $43,000 support zone.
Fresh Increase in BTC?If bitcoin stays above $46,500, it could correct higher. An initial resistance on the upside is near the $48,000 level. The first major resistance is near the $49,000 level and the 100 hourly simple moving average.
There is also a connecting bearish trend line forming with resistance near $49,000 on the same chart. To move into a positive zone, the price must clear the trend line resistance and then gain pace above the $50,000 barrier.
Technical indicators:
Hourly MACD – The MACD is now gaining momentum in the bearish zone.
Hourly RSI (Relative Strength Index) – The RSI for BTC/USD is now well below the 50 level.
Major Support Levels – $46,500, followed by $45,000.
Major Resistance Levels – $48,000, $49,000 and $50,000.
origin »Bitcoin price in Telegram @btc_price_every_hour
Bitcoin (BTC) на Currencies.ru
|
|