TA: Bitcoin Makes Comeback, Here’s Why $53.5K Holds The Key

2021-4-26 06:08

Bitcoin price tested the $47,000 support zone before starting a recovery against the US Dollar. BTC is showing positive signs, but it might face hurdles near $53,500.

Bitcoin is rising and it is trading nicely above the $50,000 pivot level. The price is now trading well above $51,000 and the 100 hourly simple moving average. There was a break above a major bearish trend line with resistance near $51,500 on the hourly chart of the BTC/USD pair (data feed from Kraken). The pair is likely to rally if there is a clear break above the $53,500 resistance zone. Bitcoin Price is Recovering

Bitcoin declined again below the $48,500 support level. BTC even spiked below the $47,500 low and it traded to a new swing low near $47,000.

The bulls appeared near the $47,000 zone and the price started a steady recovery. There was a break above the $50,000 resistance level. The price climbed above the 61.8% Fib retracement level of the last key drop from the $51,050 high to $47,000 swing low.

There was a break above a major bearish trend line with resistance near $51,500 on the hourly chart of the BTC/USD pair. The pair is now trading well above $51,000 and the 100 hourly simple moving average.

The current price action is positive and the price is now trading nicely above $52,000. On the upside, there is a major resistance waiting near the $53,200 and $53,500 levels. The 1.618 Fib extension level of the last key drop from the $51,050 high to $47,000 swing low is also near $53,500.

Source: BTCUSD on TradingView.com

A successful break and close above the $53,500 level could spark a strong upward move. In the stated case, the price is likely to rally above the $54,500 and $55,000 levels in the near term.

Dips Limited in BTC?

If bitcoin fails to clear the $53,200 and $53,500 resistance levels, it could start a downside correction. An immediate support on the downside is near the $51,500 level.

The first key support is near the $51,000 level and the 100 hourly simple moving average. A fresh close below the 100 hourly simple moving average is likely to open the doors for a drop towards the $48,500 support.

Technical indicators:

Hourly MACD – The MACD is slowly gaining strength in the bullish zone.

Hourly RSI (Relative Strength Index) – The RSI for BTC/USD is now well above the 50 level.

Major Support Levels – $51,500, followed by $51,000.

Major Resistance Levels – $53,200, $53,500 and $55,000.

Similar to Notcoin - Blum - Airdrops In 2024

origin »

Bitcoin (BTC) на Currencies.ru

$ 69974.88 (+0.14%)
Объем 24H $45.067b
Изменеия 24h: 3.07 %, 7d: -4.64 %
Cегодня L: $66916.68 - H: $70339.13
Капитализация $1383.974b Rank 1
Цена в час новости $ 52908.94 (32.26%)

bitcoin showing hurdles face positive signs might

bitcoin showing → Результатов: 126


Bitcoin is up 24% in 2 days, but it’s showing two key signs of a local top

The Bitcoin price has recovered by 24 percent in the last 32 hours from around $4,394 to $5,500. It has since stabilized at $5,300, but it is now showing two signs of a local top. What are the two signs Bitcoin is showing? While the Bitcoin price has shown a promising upsurge since March 16 […] The post Bitcoin is up 24% in 2 days, but it’s showing two key signs of a local top appeared first on CryptoSlate.

2020-3-18 21:22


Фото:

Will Litecoin Manage to Maintain its Bullish Momentum?

On Feb 16, the Litecoin price underwent a rapid price decrease. However, it is still trading above significant support areas and its long-term outlook remains bullish. Cryptocurrency swing trader @PostyXBT posted a Litecoin chart showing that while the price was initially successful in breaking through resistance, the recent Bitcoin decrease caused it to fall right […] The post Will Litecoin Manage to Maintain its Bullish Momentum? appeared first on BeInCrypto.

2020-2-18 19:10


Bitcoin Price History – Technical Analysis Showing Bullish Sign From 2015

Bitcoin price has consolidated the last week for the most part with some downside pressure. The last 7 days, Bitcoin price has returned -1.53% as the market shifted towards altcoins. Despite Bitcoin price falling the last week, it should be noted that technicals right now are highly bullish based on price action witnessed in April […] The post Bitcoin Price History – Technical Analysis Showing Bullish Sign From 2015 appeared first on NullTX.

2020-2-18 11:03


Фото:

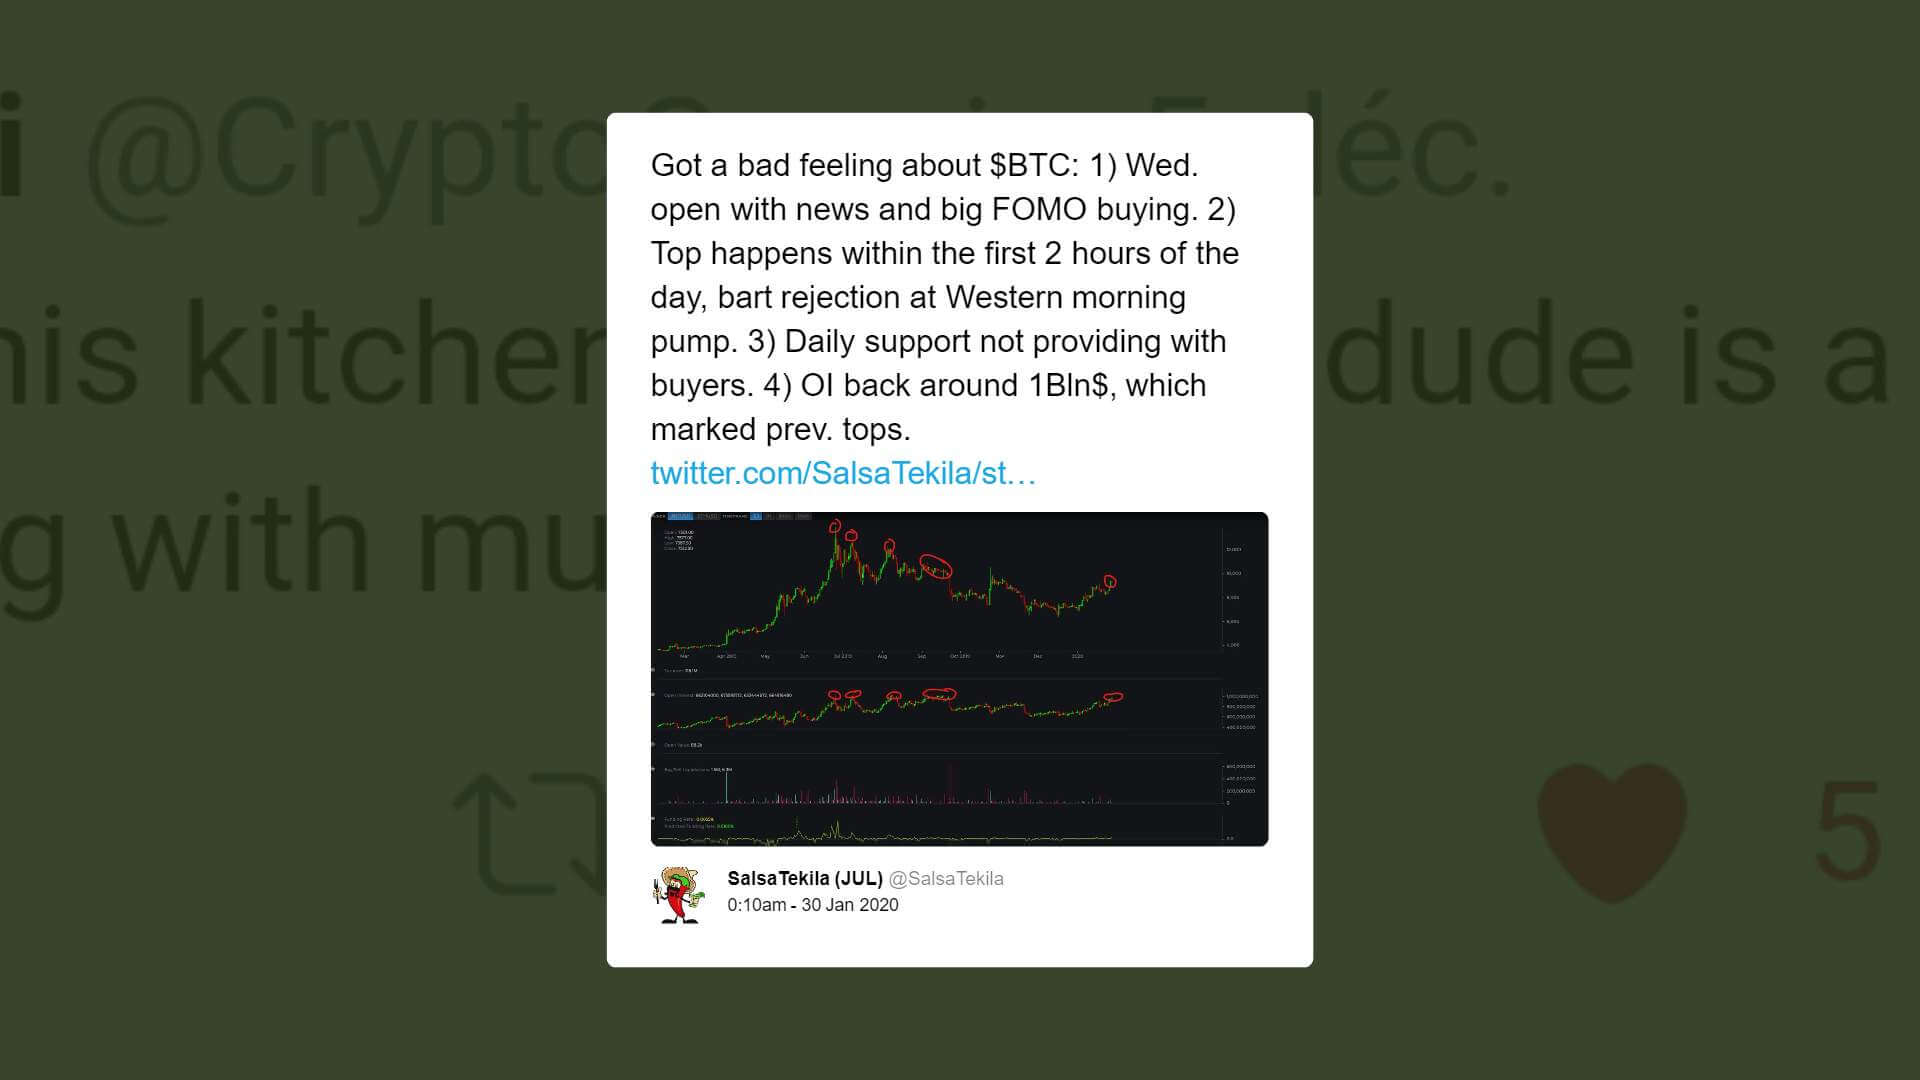
Bitcoin just rejected $9450 again; now showing 4 factors of a potential pullback

The Bitcoin price just rejected $9,450 again on lower time frames and is vulnerable to a short-term pullback. It satisfies all four factors that previously led to deep corrections in the past. As explained by one cryptocurrency trader, the four factors that often trigger the Bitcoin price to decline substantially after an extended rally are: […] The post Bitcoin just rejected $9450 again; now showing 4 factors of a potential pullback appeared first on CryptoSlate.

2020-1-30 02:08


Фото:

China BTC Volume on LocalBitcoins Hits 2-Year Low, Baidu Searches Dwindle

LocalBitcoins is showing its lowest volume in China in two years. Volume for the popular marketplace hovered at around 4.5 million yuan for the week of Jan 25. This has coincided with a drop in Bitcoin’s search volume on the Chinese search engine, Baidu, which has also hit a new low over the past 30 […] The post China BTC Volume on LocalBitcoins Hits 2-Year Low, Baidu Searches Dwindle appeared first on BeInCrypto.

2020-1-27 12:01