2020-7-14 17:10 |
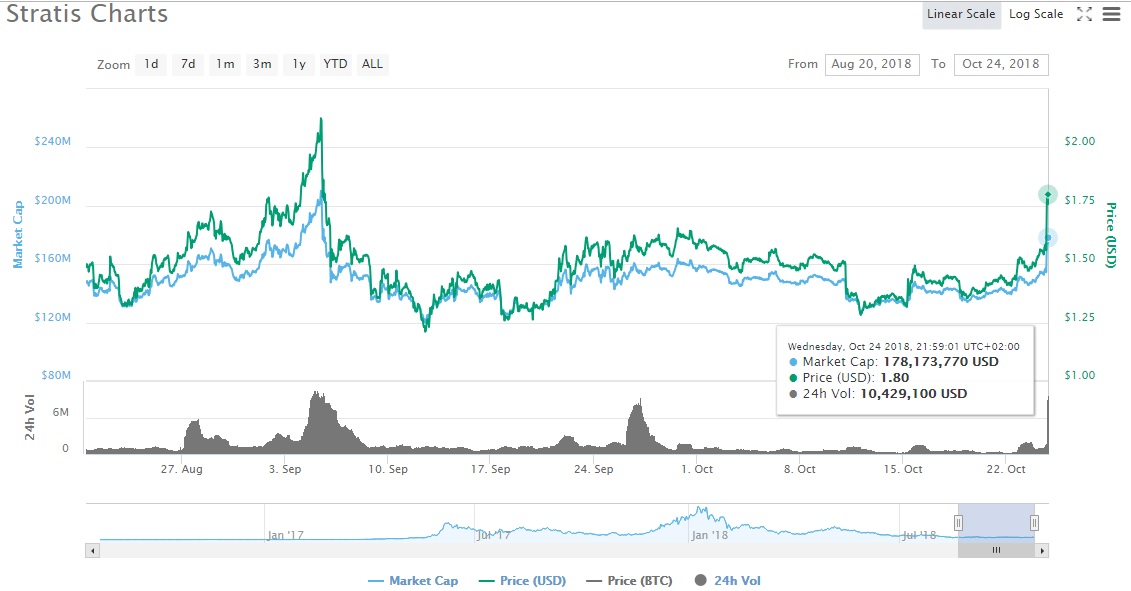
The Stratis (STRAT) price has broken out from a resistance area that had previously been in place since August 2019.
After a decrease that validates this area as support, the STRAT price is expected to continue moving upwards.
Stratis Breaks OutThe STRAT price had been facing resistance from the 5,700 satoshi level since December 2019. After three unsuccessful breakout attempts, the price was finally able to overtake this resistance on July 8. The price continued to increase until it reached a high of 7,656 satoshis, and has corrected slightly since.
The 50 and 200-day moving averages (MA) have made a bullish cross, a sign that STRAT has already begun an upward trend. After a possible re-test of this same resistance area, the price will likely resume its upward movement.
STRAT Chart By TradingviewCryptocurrency trader @CryptoNewton outlined a path predicting that the STRAT price is expected to increase until 140,000 satoshis.
STRAT Chart By TradingviewWhen looking at the weekly chart, such an increase seems feasible. We can see that the aforementioned resistance area had been in place since August 2019, and the price broke out after generating bullish divergence for nearly a year.
The closest resistance area is found at 14,000 satoshis, coinciding with the target given in the tweet. The 0.5 Fib level of the entire decrease is found at 220,000 satoshis.
STRAT Chart By Tradingview Future MovementA closer look at the price movement since the upward move began reveals that the price has possibly finished a five-wave Elliott formation.
This is visible when drawing an ascending parallel channel connecting wave (2) and (4). After breaking out from the channel, the price dropped to the middle of the channel, completing its fourth wave, before breaking higher once more.
Therefore, the price is possibly completing an A-B-C correction, which could end near the 0.5 Fib level at 54,000 satoshis, or slightly lower, at the 0.618 Fib level at 48,500 satoshis.
STRAT Chart By TradingviewIn the longer-term, this entire movement seems to have been the first wave of a larger five-wave formation. While it is still too early to predict where the tops of waves (3) and (5) will occur, it looks likely that the price will at least reach the 140,000 satoshi resistance area, and possibly the 0.5 Fib level at 220,000 satoshis.
STRAT Chart By TradingviewTo conclude, the STRAT price has possibly begun a long-term bullish trend. After a short corrective period, the upward movement is expected to resume.
Click here for BeInCrypto’s latest Bitcoin analysis!
The post STRAT Begins Upward Move and Breaks Out from Long-Term Range appeared first on BeInCrypto.
origin »Bitcoin price in Telegram @btc_price_every_hour
Stratis (STRAT) на Currencies.ru
|
|