2022-7-6 17:00 |
STEPN (GMT) has broken out from a short- and a long-term resistance line and is gradually moving towards its range high.
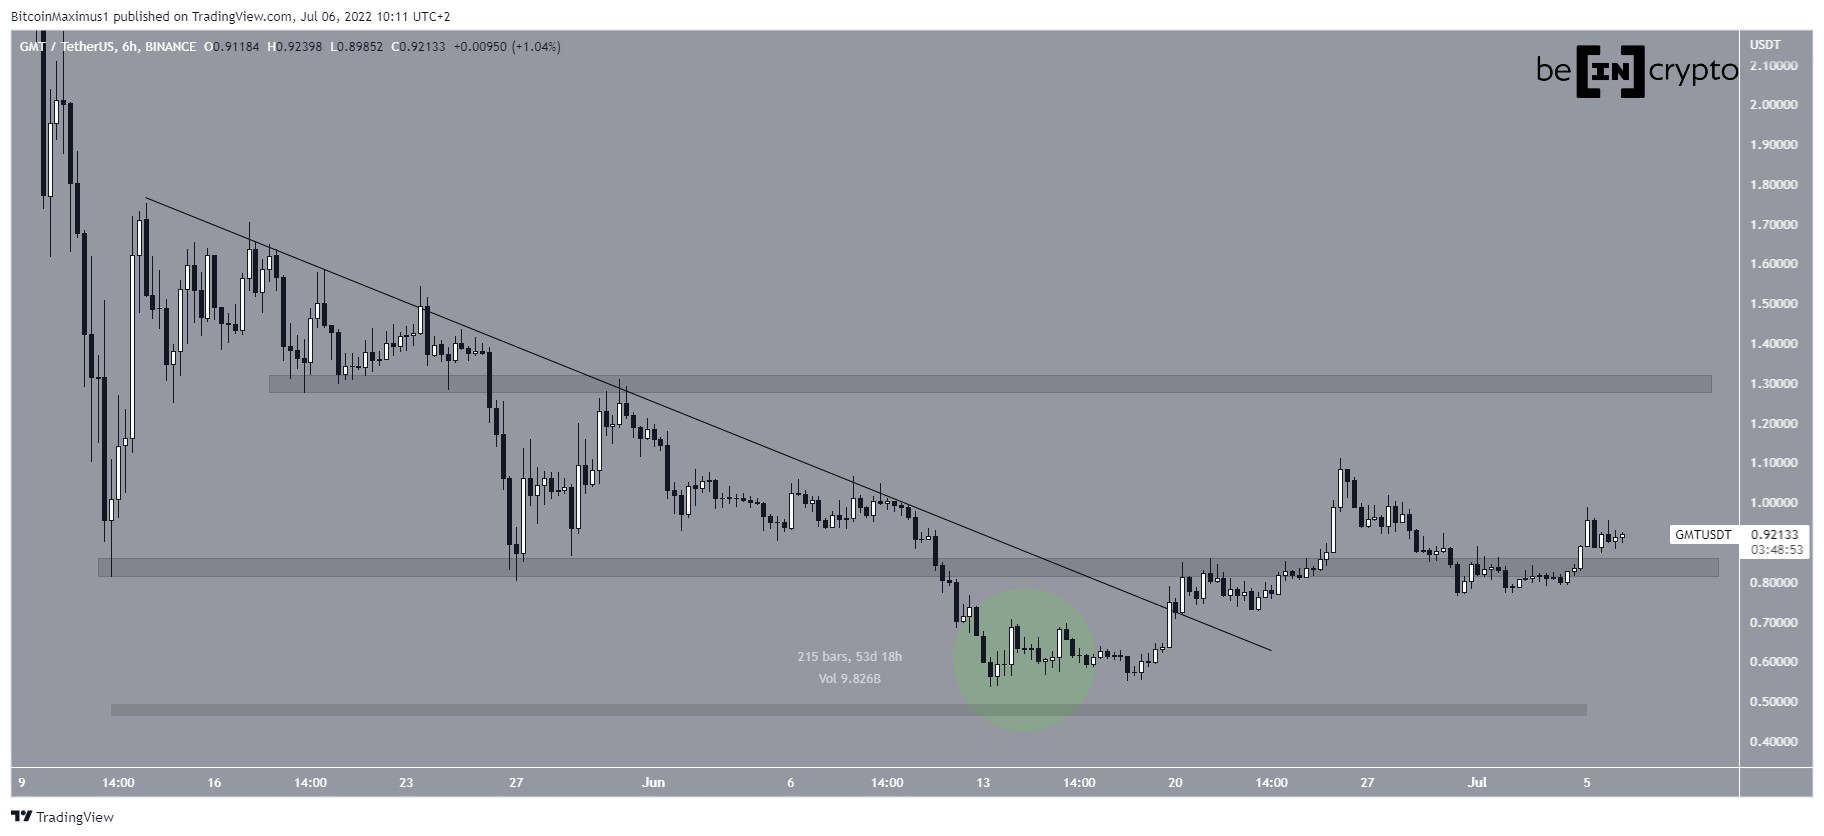
GMT had been falling underneath a descending resistance line since May 13. The downward movement led to a low of $0.53 on June 13. Initially, this caused a breakdown from the $0.84 horizontal support area.
However, the price has been increasing since and broke out from the descending resistance line on June 20 and reclaimed the $0.84 area shortly afterwards. This renders the previous breakdown as only a deviation (green circle). All-in-all, the support area has been in place for nearly 54 days.
If the upward movement continues, the closest resistance area would be at $1.34.
GMT/USDT Chart By TradingView Short-term movementCryptocurrency trader @Celtralt tweeted a chart of GMT, which shows that the price has bounced at a horizontal support area.
Source: TwitterSince the tweet, the price has also broken out from a short-term descending resistance line. It is currently attempting to move above the 0.618 Fib retracement resistance level. It made an unsuccessful attempt at doing so on June 5 and is now gearing up for another attempt.
If successful in doing so, the price would be expected to increase towards the $1.34 resistance area.
GMT/USDT Chart By TradingView GMT wave count analysisThe most likely wave count suggests that the price is in the C wave of an A-B-C corrective structure (black). Giving waves A:C a 1:1 ratio would lead to a high of $1.34. There is a clear five sub-wave upward movement (red) that completed wave A.
If waves A:C have a 1:1 ratio, this would lead to a high of $1.34, taking the price all the way to the main horizontal resistance area.
GMT/USDT Chart By TradingViewFor Be[in]Crypto’s latest bitcoin (BTC) analysis, click here
The post STEPN (GMT) Reclaims 54-Day Support Area After Deviation appeared first on BeInCrypto.
origin »Bitcoin price in Telegram @btc_price_every_hour
Mercury Protocol (GMT) на Currencies.ru
|
|


