2019-10-8 01:59 |
Stellar Lumens price is currently lingering above the $0.0580 support zone.XLM price is hitting resistance made up of two moving averages at $0.061 and $0.063.A mini bull run induced by a market-wide move could see XLM reaching $0.070 resistance level.Total market cap analysis
Let’s first look at what the overall market is doing. As you know, all coin prices are highly correlated with bitcoin’s price action and by extension with the whole market. Every time we see a surge or plunge of the total market cap, it spills over to the individual coins and their prices.
Market has lost seen a mild recovery today as it defended the support at $206 billions and is now testing a sturdy resistance at $219 billions (data by Tradingview, CMC data is bigger by approx $8 billions).
Should the market break through the $219 billion zone, we could see a swift move up to the $240 billion zone, area from which we saw this horrific drop in the last week of September.
XLMUSDAs mentioned in the highlights above, XLM is consolidating right above support zone of $0.058. Should the volume pick up and overall market sees some recovery, XLM would burst through the resistances of its MAs, XLM has a free path to reach $.070.
4 hours MACD – The MACD for XLM/USD is slowly moving into the bullish zone.4 hours RSI – The RSI for XLM/USD is now well above the 50 level.Key Support Levels – $0.0550 and $0.0500.Key Resistance Levels – $0.0626, $0.0650 and $0.0750.Social MetricsStellar’s sentiment score, measured by the market analytics firm Omenics, paints a neutral picture.
Read our updated guide on best XLM wallets.
Omenics wraps its analysis up into a single simple indicator known as the SentScore, which is formed from the combination of five different verticals:
NewsSocial MediaBuzzTechnical AnalysisFundamentalsInterpreting the SentScore’s scale:
0 to 2.5: very negative2.5 to 4.0: somewhat negative zone4.0 to 6.0: neutral zone6.0 to 7.5: somewhat positive zone7.5 to 10: very positiveStellar currently has a Sentscore of 4.7, with positive media coverage but bearish technicals.
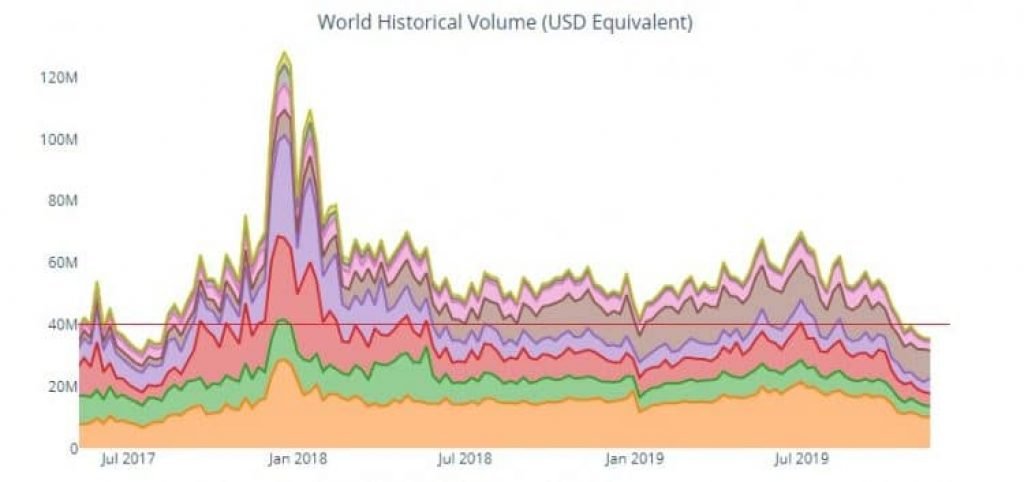
Trading volume and buy supportTrading volumes are looking weak: reported volume in the last 24 hours was $24m and “Real 10” volume was $9m. So, the reported volume is 2.5x larger than the “Real 10” volume (trading volume on the exchanges that prevent wash trading). This means that XLM’s liquidity is mildly inflated which is pretty good value in comparison with other top coins that have their metrics inflated by huge figures (20x discrepancy is not uncommon).
All price predictions in one place: click here.
Moreover, XLM comparatively has a weak buy support, according to coinmarketbook.cc. Buy support is measuring sum of buy orders at 10% distance from the highest bid price. This way we can eliminate fake buy walls and whale manipulation and see the real interest of the market in a certain coin. XLM currently has $2.9 million of buy orders measured with this method, which sets XRP buy support/market cap ratio at 0.24% which is a similarly low ratio to bitcoin and ethereum. Bitcoin and Ethereum have a 0.20% and 0.28% ratios, respectively. This novel metric indicates there are a lot of manipulations, inflated liquidity and fake orders on XLM trading pairs.
The post Stellar Lumens (XLM) Price Analysis: Laying The Groundwork For A Mini Run appeared first on CaptainAltcoin.
origin »Bitcoin price in Telegram @btc_price_every_hour
Stellar (XLM) на Currencies.ru
|
|


