Sorry Bulls, Bitcoin Isn’t Going Parabolic Just Yet: Here’s Why

2020-1-16 15:00

In the middle of 2019, when Bitcoin had just surged above $10,000 on the back of an influx of buying pressure caused by market FOMO amongst investors, analysts thought BTC was on the verge of going parabolic again. Related Reading: This Late Night Host Just Exposed Millions to Bitcoin, Again You see, after a year of brutal 80% decline in a period now known as “Crypto Winter,” which brought BTC as low as $3,150, investors were ready for some sunlight. The 300% pump that took place in six months’ time was enough to convince investors that Bitcoin was about to wave goodbye to five digits and “moon.” But, in classic cryptocurrency fashion, BTC tanked, with the price falling 50% to a low of $6,400 by December of last year. But, since bottoming there, the leading cryptocurrency has rallied by over 30%, leaving emotional investors to once again say a parabolic move that will bring Bitcoin above $100,000 is on the horizon.  But, per a simple analysis of a simple indicator, this rally is not here. Not here yet, anyway. Bitcoin Still Under Key Level  Cryptocurrency trader Coiner Yadox recently noted that Bitcoin’s long-term phases of bull and bear have always been easily defined by the one-week Relative Strength Index (RSI), with readings of under 55 indicating bear market and readings of above 55 indicating bull market. Indeed, as he depicts in the chart below, whenever Bitcoin was in a bull market, the RSI always stayed above 55, bouncing off this key level on multiple occasions to allow BTC to set fresh all-time highs. The vice-versa is also true. $BTC $BTCUSD On the weekly, Bull market are where RSI>55, and Bear Market when RSI<55. Right now, we are exactly at this crucial line.Which way ? pic.twitter.com/y5568fDYmS — Coiner-Yadox (@Yodaskk) January 15, 2020 So where does Bitcoin stand right now? Per Yadox’s chart, the weekly RSI is right under 55 at 54, meaning that the latest surge in the Bitcoin market hasn’t been enough to force the cryptocurrency into a bull market on a macro basis. For BTC to confirm the bull market, its weekly RSI will need to make a close above the key 55 level, which would require further appreciation in the cryptocurrency market.   Related Reading: Crypto Tidbits: Elon Musk Pokes Bitcoin Bear, Japanese Giants Delve Into Cryptocurrency Mining, Baidu’s Blockchain Beta Can It Break Through? So can Bitcoin do it? Can prices rally enough this week or over the next couple of weeks to allow the weekly RSI to print a close or multiple closes above the key 55 level? According to a number of analysts, for sure. Dave the Wave, the cryptocurrency trader who in the middle of 2019 called Bitcoin’s dramatic 50% decline to $6,400, said that with BTC’s latest move, the price has broken above a key downward channel that has restricted price action for some seven months now, noting that a wave analysis he did suggests BTC has room to rally to $10,000 by the end of this month or early-February. He pointed out in a separate tweet/analysis that Bitcoin’s weekly RSI and MACD indicators look effectively identical to a similar formation near the end of October, prior to a massive BTC surge higher that brought the cryptocurrency dozens of percent higher in the few weeks. Related Reading: Ethereum’s Price Chart Just Printed This Extremely Bullish Signal Featured Image from Shutterstock The post appeared first on NewsBTC.

Similar to Notcoin - Blum - Airdrops In 2024

origin »

Bitcoin (BTC) íà Currencies.ru

$ 69363.7 (-0.22%)
Îáúåì 24H $46.01b
Èçìåíåèÿ 24h: 2.34 %, 7d: -4.63 %
Cåãîäíÿ L: $69039.59 - H: $69761.69
Êàïèòàëèçàöèÿ $1371.891b Rank 1
Öåíà â ÷àñ íîâîñòè $ 8673.21 (699.75%)

bitcoin parabolic going influx market pressure fomo

bitcoin parabolic → Ðåçóëüòàòîâ: 126


Bitcoin Forms Parabolic Trendline, But Veteran Trader Eyes Potential Correction

Bitcoin and the entire cryptocurrency market have been caught within a parabolic advance as of late, with BTC leading the charge as altcoins follow its lead Where the cryptocurrency trends next will undoubtedly depend on whether or not bulls can maintain control of its price action as it approaches $30,000 This rally is nothing short of parabolic, with Bitcoin tapping a half a trillion-dollar market cap yesterday evening One veteran trader is now pointing to […]

2020-12-29 22:00


Bitcoin Curiosity Went Parabolic During Tuesday’s Massive Rally: Google

Google’s trend explorer shows that global searches for the keyword ‘bitcoin’ more than tripled during Tuesday’s massive rally. Bitcoin Searches Spike as Crypto Market Booms While the precise number of searches was not available, Google’s backend algorithms determined Tuesday’s search volume by comparing it with the number of queries over time.

2019-4-3 22:16


Bitcoin Price Analysis Update: BTC Held Up by Weekly MA, But Still Following the “Parabolic Trend”

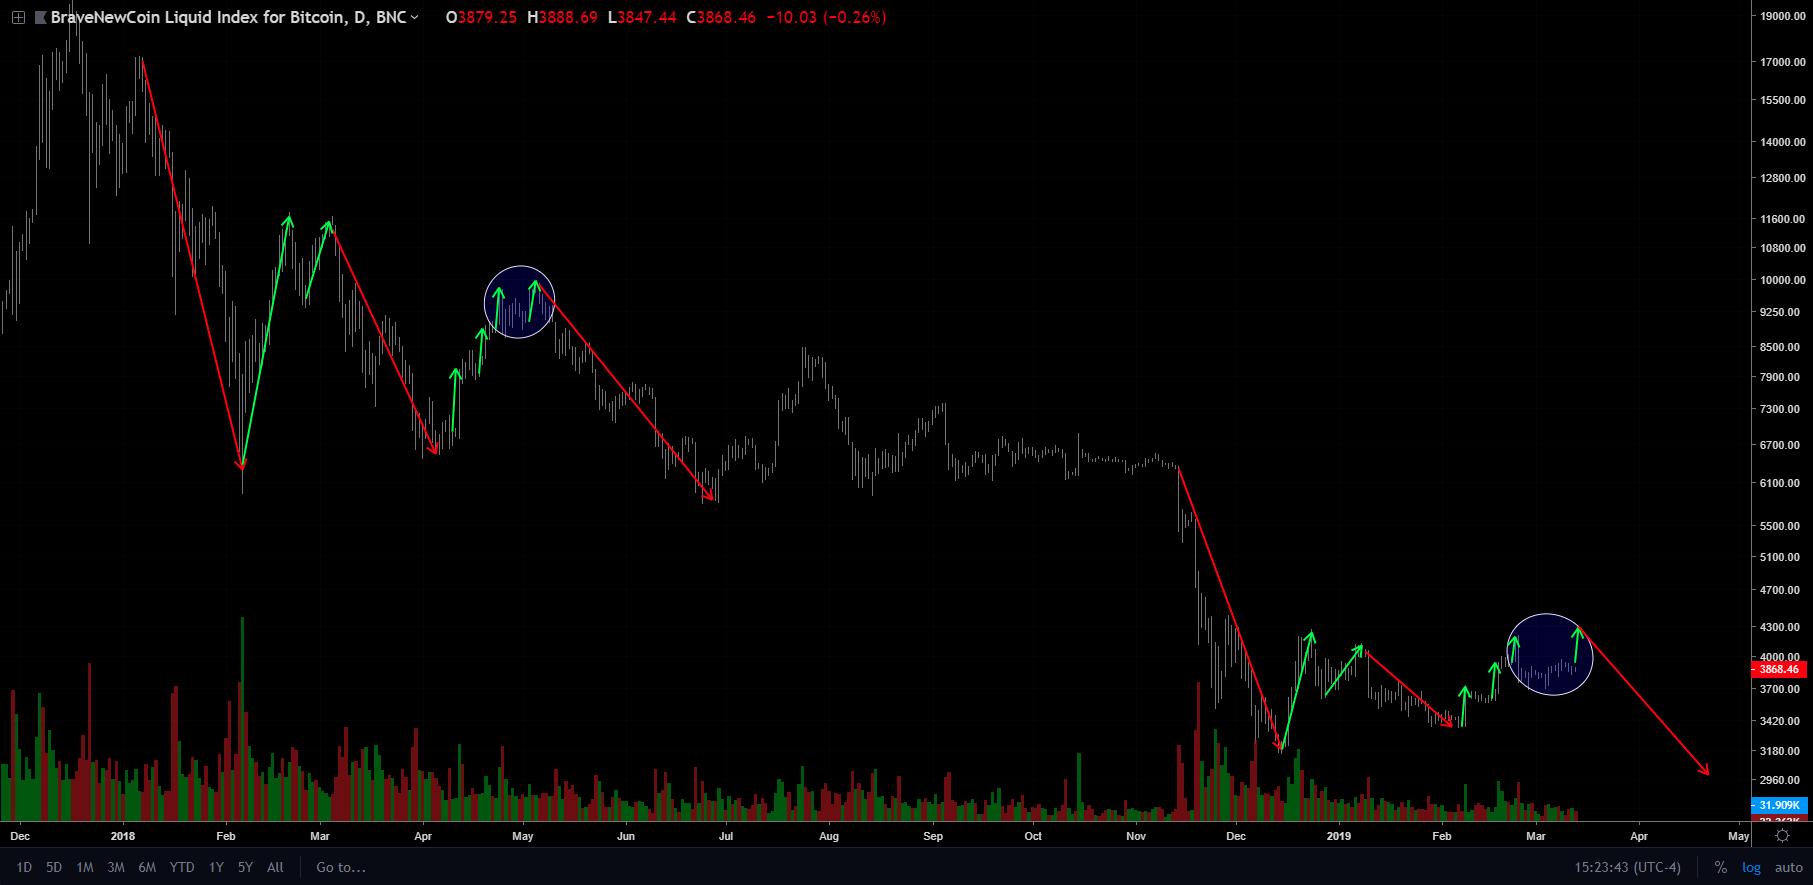
The leading cryptocurrency is back at above $3,900 looking to break the $4k mark. On March 4th, Bitcoin price went from $3,680 to $3,870 level seeing a surge of 5 percent. Since then, Bitcoin has been seeing a slight upward shift in the price as it slowly moved to the $3,890 mark. The leading cryptocurrency […]

2019-3-8 19:46


Poll Reveals Majority of Crypto Investors See Bitcoin Price at $100,000 to Millions Long-Term

Ever since the mysterious Satoshi Nakamoto released Bitcoin into the wild, the world has been speculating over the first-ever crypto and its long term validity and value. While the current bear trend and over 84% decline in Bitcoin has crushed much of the enthusiasm the market saw during the 2017 parabolic advance and media blitz,.

2019-3-1 04:00


Ôîòî:

Australian Entrepreneur’s Bitcoin Position Loses $3 Million in Value, but He Remains Optimistic

Due to the parabolic rise of crypto prices followed by a prolonged ‘crypto winter,’ stories have emerged of crypto supporters who made and lost millions in the market. One of such people is Sam Karagiozis, an Australian entrepreneur who’s crypto holdings have reportedly lost millions in valuation since the crash.

2019-1-22 18:58


Crypto Investor: Bitcoin May Retest $20,000 With Next Wave Of Adoption

Since Bitcoin (BTC) breached the monumental $20,000 price milestone and subsequently crashed, crypto investors en-masse have sought to determine when the asset would retest five-digits. While an array of crypto pundits have speculated, throwing their zany predictions into the crockpot that is Twitter, the date of the next parabolic rally’s commencement is still elusive.

2019-1-21 21:00


Ôîòî:

Bitcoin Price Analysis: Bear Pennant Breakout Puts $1,700 Price in Sight

Another week, another low. Bitcoin’s market has been bleeding relentlessly for weeks and now, after falling 50% in value in just one month, the market has managed to break south of a major bearish consolidation pattern called a bear pennant:Figure 1: BTC-USD, 4-Hour Candles, Bear Pennant BreakoutThis is a massive bear pennant with a staggering $2,000 measured move.

2018-12-12 01:52


Crypto Bull: Bitcoin (BTC) Under $4,000 Driven By Emotional Overreaction

Parabolic Move, Then 80% Correction  Ronnie Moas, an impassioned, outspoken Bitcoin (BTC) bull, recently sat down with CoinTelegraph in an exclusive interview. Speaking on crypto’s most recent downturn, which sent the aggregate value of crypto assets under $140 billion, Moas maintained his bullish sentiment, making it abundantly clear that BTC isn’t dead in the water.

2018-12-3 21:50


Ôîòî:

Bitcoin Price Analysis: Wait and See Where Recent Signs of Strength Lead

This week realized a big gain as bitcoin enjoyed a 25% rally from its local bottom before topping out around $4,400. Support currently appears to be established in the mid-$3,000s as the market remains indecisive over its next move:Figure 1: BTC-USD, Daily Candles, Current Support LevelFigure 1 shows the relevance of the current support level as it represents a previous support level that was never properly retested during last year’s parabolic bull market.

2018-11-30 01:45


Ether Price Analysis: Untested Support Leaves Shaky Foundation During Drop

Much like the rest of the crypto market, ether has found itself devalued by more than 90% since its all-time high of $1,400 back in December of 2017. And now, almost a year later, ether sits just above $100 on what appears to be shaky ground during its latest round of selling over the last few weeks:Figure 1: ETH-USD, Daily Candles, Rapid DescentSimilar to bitcoin’s movement discussed in yesterday’s article, ETH-USD experienced a parabolic growth profile during its bull run.

2018-11-28 01:55


Ôîòî:

Bitcoin Price Analysis: Yearly Support Breaks as Bitcoin Tests Underlying Demand

After months and months of consolidation, the yearly support finally broke and now bitcoin has found itself in the lower $5000s for the first time since 2017:Figure 1: BTC-USD, Daily Candles, Broken SupportBitcoin managed to drop a staggering 16% yesterday as the market sliced through the long held support like a knife through butter.

2018-11-16 01:28


Ôîòî:

NYSE Owner’s BAKKT Platform ‘Makes Bitcoin ETF Redundant’: Commentator

Intercontinental Exchange (ICE) digital asset platform Bakkt will “make a Bitcoin ETF completely redundant” when it launches in November, a prominent social media commentator has forecast. ‘Completely Redundant’ Commenting on the news the New York Stock Exchange owner was collaborating with Microsoft, Starbucks and others on a regulated “ecosystem” for digital assets, Twitter user known as Parabolic Trav said that the platform – known as Bakkt – would fulfill the functions originally intended for an Read More The post NYSE Owner’s BAKKT Platform ‘Makes Bitcoin ETF Redundant’: Commentator appeared first on Bitcoinist.com.

2018-8-6 15:00


Ôîòî:

Bitcoin Price Analysis: New Low on Low Volume Breeds Potential Bullish Set-up

Bitcoin sits precariously perched at the bottom of the annual market low and many bitcoin investors aren’t sure what to make of it. Although the market seems to be continuing its drift to new lows with greater and greater ease, there are a couple of bullish signals worth considering while the market continues to consolidate: Figure 1: BTC-USD, Daily Candles, New Market LowOn Friday, June 29, 2018, for the first time this year, the daily candles closed below the annual low of $6,000s.

2018-7-1 19:35