2024-2-1 21:04 |
SOL/USDT trading strategy Buy/sell asset: Buy SOL/USDT Entry price: 95.50 Stop loss: 89.96 Leverage: 1x Take profit 1: 102.0 Take profit 2: 107.0 Take profit 3: 116.70 Timeframe: 1-2 weeks Maximum profit: 22% Maximum loss: 5% SOL/USDT chart and technical analysis
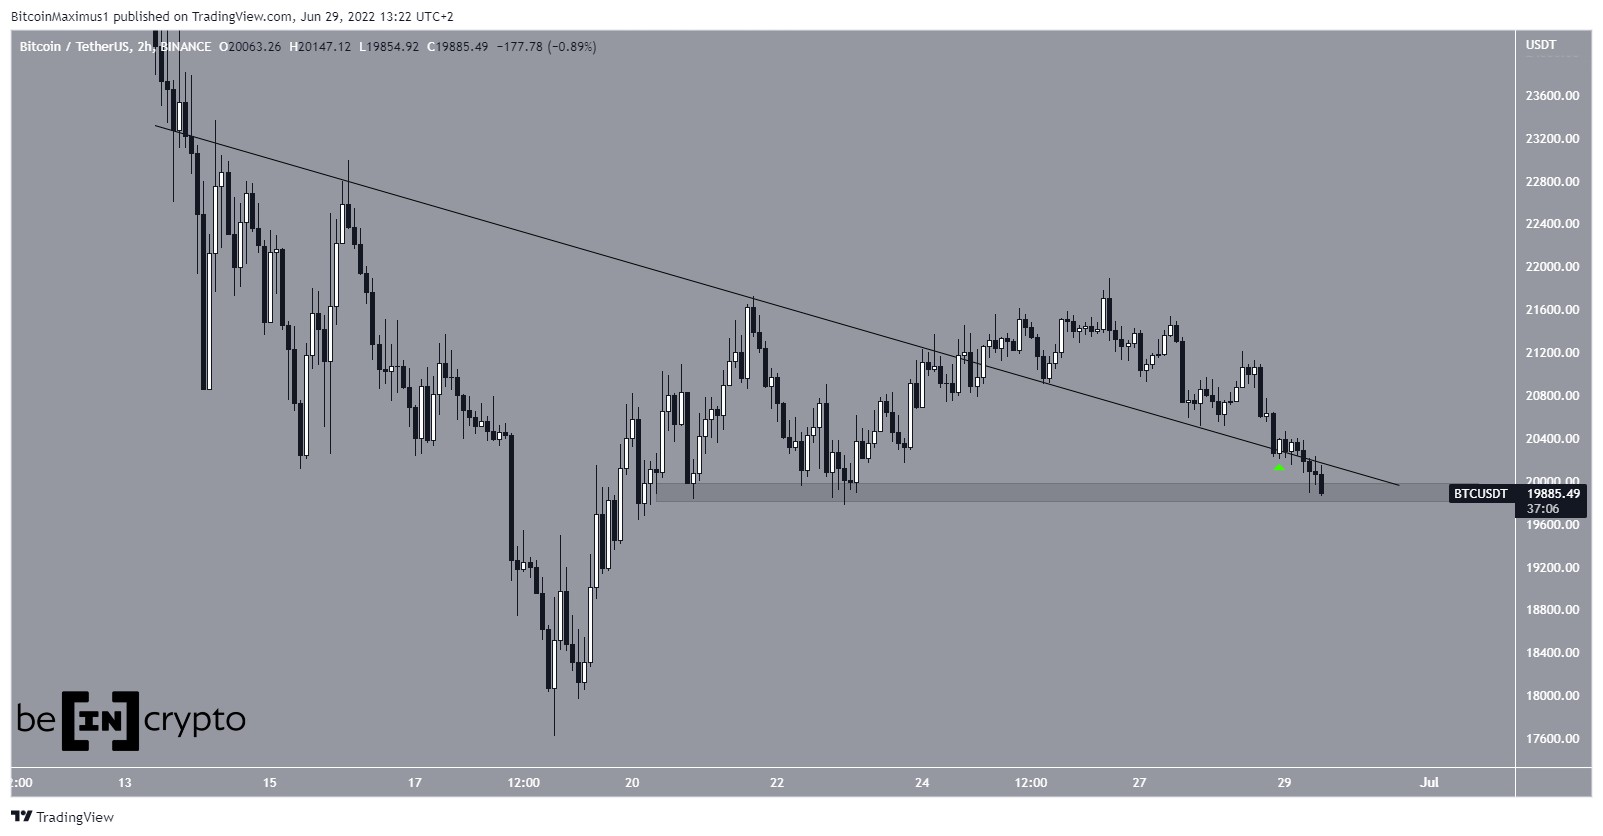
Solana is recovering from the recent drop and has closed above the previous high of 102.60. The price is expected to continue the rally ahead as the market structure is turning bullish.
Currently, the price is making a correction and will likely retrace to the 95.50 support level before making new highs. The price closed above the 106.60 resistance area which is a positive indication for a potential upward rally.
I am considering the 95.50 support level for long entries as this level is around the 0.50 key Fibonacci retracement. Moreover, there is a bullish order block and displacement around the same level.
Solana fundamental analysisFundamentally, the Feds will announce the interest rates decision today, which will possibly have a significant impact on the overall crypto market.
If the the interest rates are reduced then the price of SOL/USDT is likely to rally, on the contrary, if the rates are kept unchanged then it may drop and follow the price action.
Solana to Tether trade idea takeaways SOL/USDT is likely to continue the bullish rally as the market structure turns bullish. The price of Solana will possibly reach the 116.70 supply area in the coming days. Multiple take-profit levels have been added to secure profit along the way. The risk-to-reward ratio on this trade is 1:3.8. The entry and stoploss prices have been placed at secure levels with the least probability of getting hit. Good luck!The post SOL/USDT technical analysis: Solana chart analysis points to a continued rally appeared first on Invezz
origin »Bitcoin price in Telegram @btc_price_every_hour
ChartEx (CHART) на Currencies.ru
|
|