2025-12-17 08:18 |
Solana started a recovery wave above the $126 zone. SOL price is now consolidating and faces hurdles near the $132 zone.
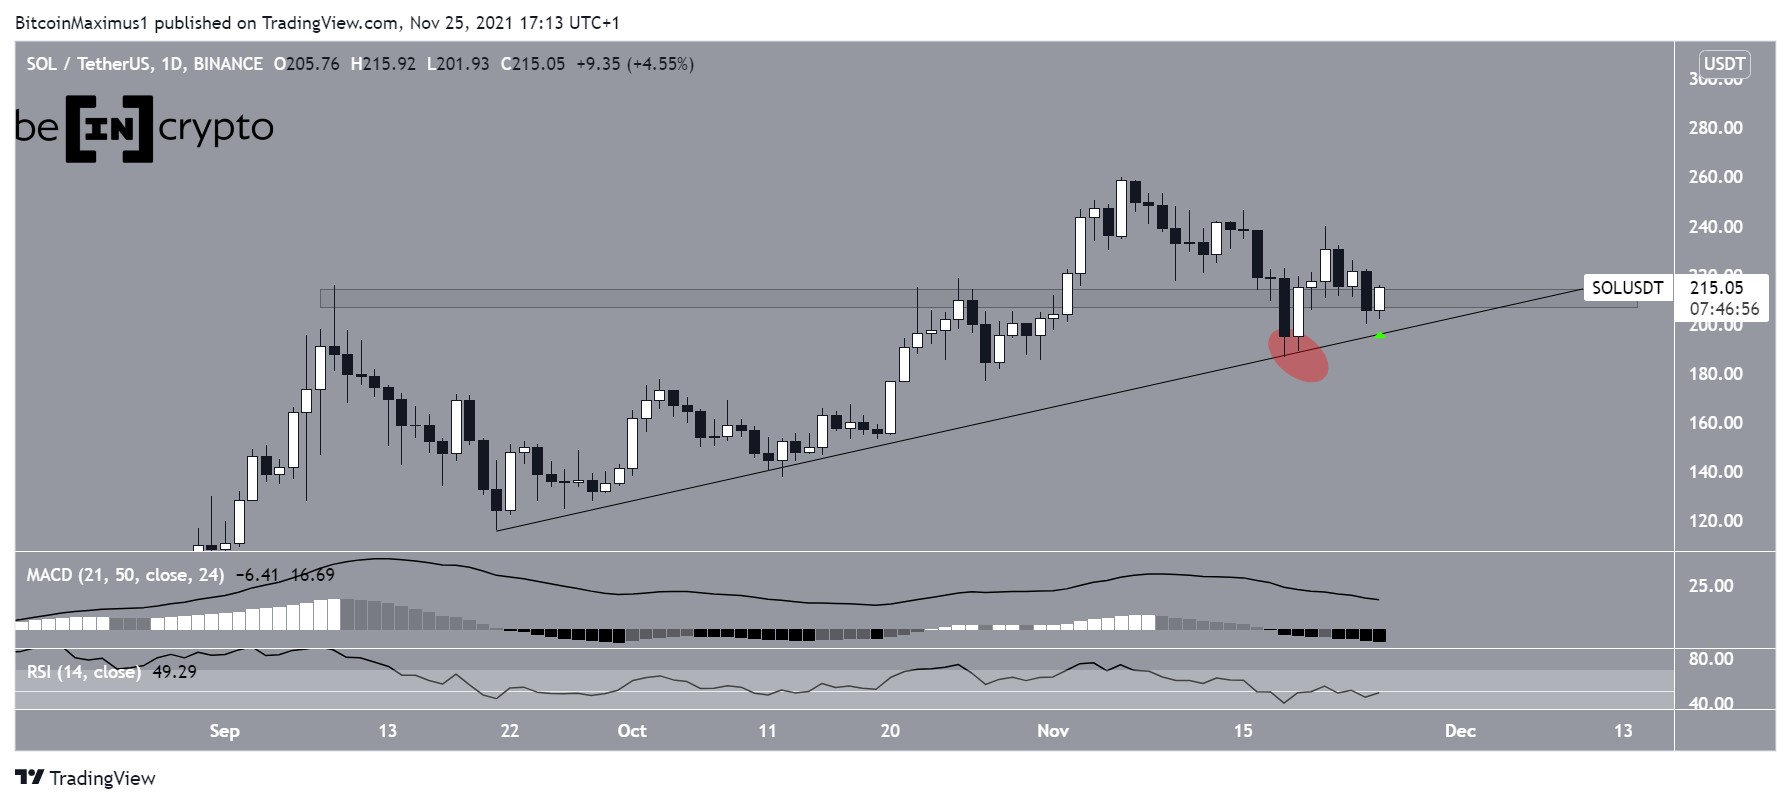
SOL price started a decent recovery wave above $126 and $128 against the US Dollar. The price is now trading below $130 and the 100-hourly simple moving average. There is a key bearish trend line forming with resistance at $132 on the hourly chart of the SOL/USD pair (data source from Kraken). The price could continue to move up if it clears $130 and $132. Solana Price Faces ResistanceSolana price remained stable and started a decent recovery wave from $124, like Bitcoin and Ethereum. SOL was able to climb above the $126 level.
There was a move above the 23.6% Fib retracement level of the downward move from the $136 swing high to the $124 low. The bulls even pushed the price above $130. However, the bears remained active near $130. There is also a key bearish trend line forming with resistance at $132 on the hourly chart of the SOL/USD pair
Solana is now trading below $130 and the 100-hourly simple moving average. On the upside, immediate resistance is near the $130 level, the 100-hourly simple moving average, and the 61.8% Fib retracement level of the downward move from the $136 swing high to the $124 low.
The next major resistance is near the $132 level. The main resistance could be $135. A successful close above the $135 resistance zone could set the pace for another steady increase. The next key resistance is $144. Any more gains might send the price toward the $150 level.
Another Decline In SOL?If SOL fails to rise above the $132 resistance, it could continue to move down. Initial support on the downside is near the $126 zone. The first major support is near the $124 level.
A break below the $124 level might send the price toward the $116 support zone. If there is a close below the $116 support, the price could decline toward the $108 zone in the near term.
Technical Indicators
Hourly MACD – The MACD for SOL/USD is gaining pace in the bearish zone.
Hourly Hours RSI (Relative Strength Index) – The RSI for SOL/USD is below the 50 level.
Major Support Levels – $126 and $124.
Major Resistance Levels – $130 and $132.
origin »Bitcoin price in Telegram @btc_price_every_hour
Sola (SOL) на Currencies.ru
|
|