2020-12-8 15:56 |
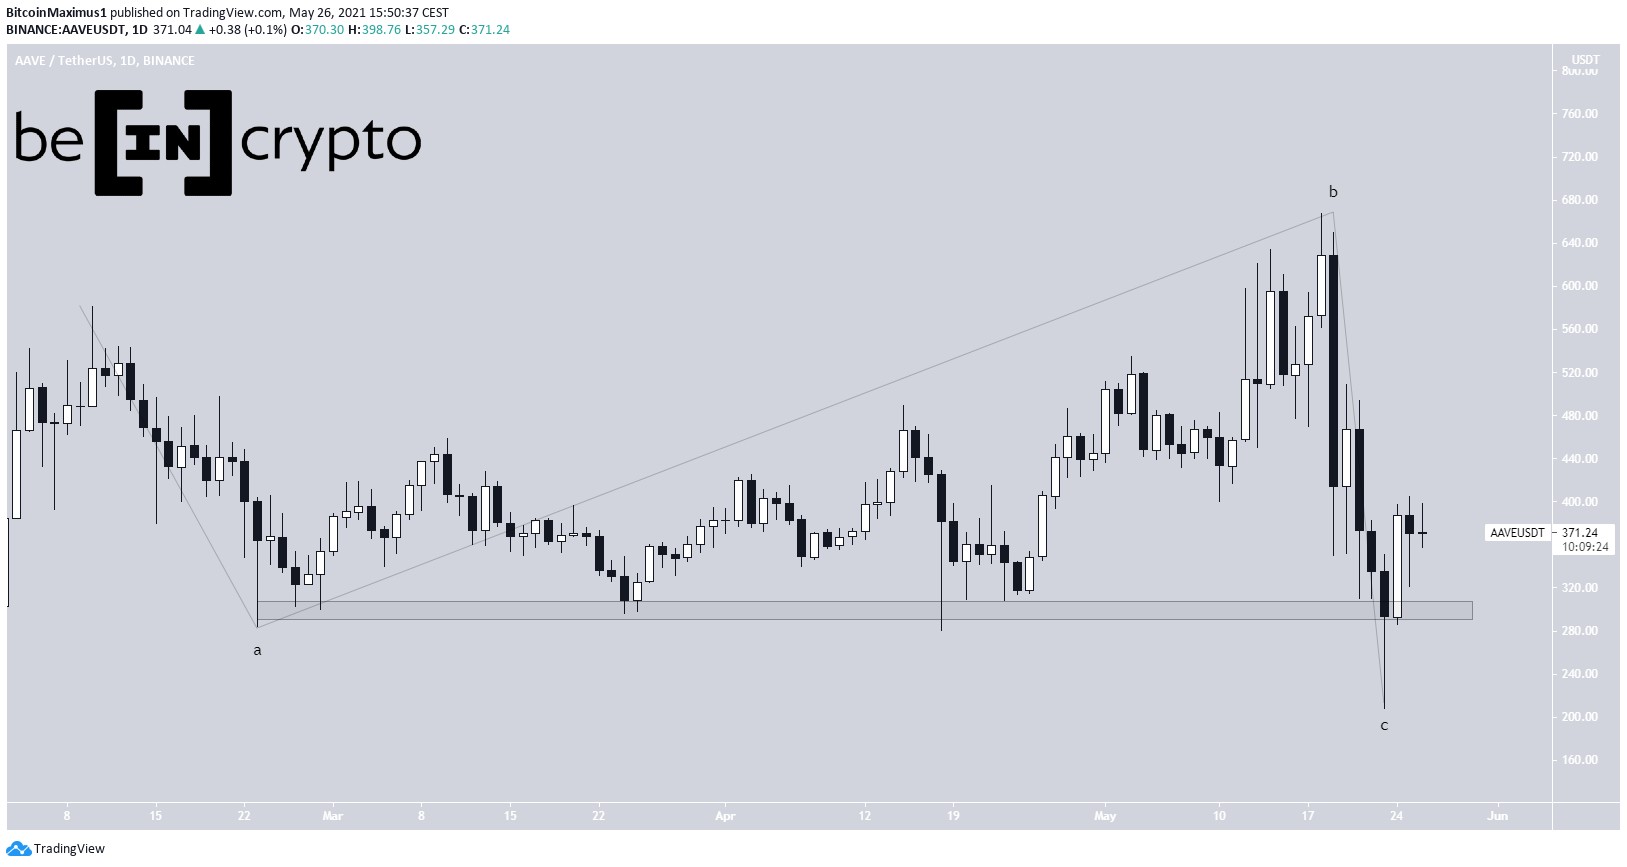
The Solana (SOL) price is decreasing and has reached an important support area but has not yet shown any bullish reversal signs.
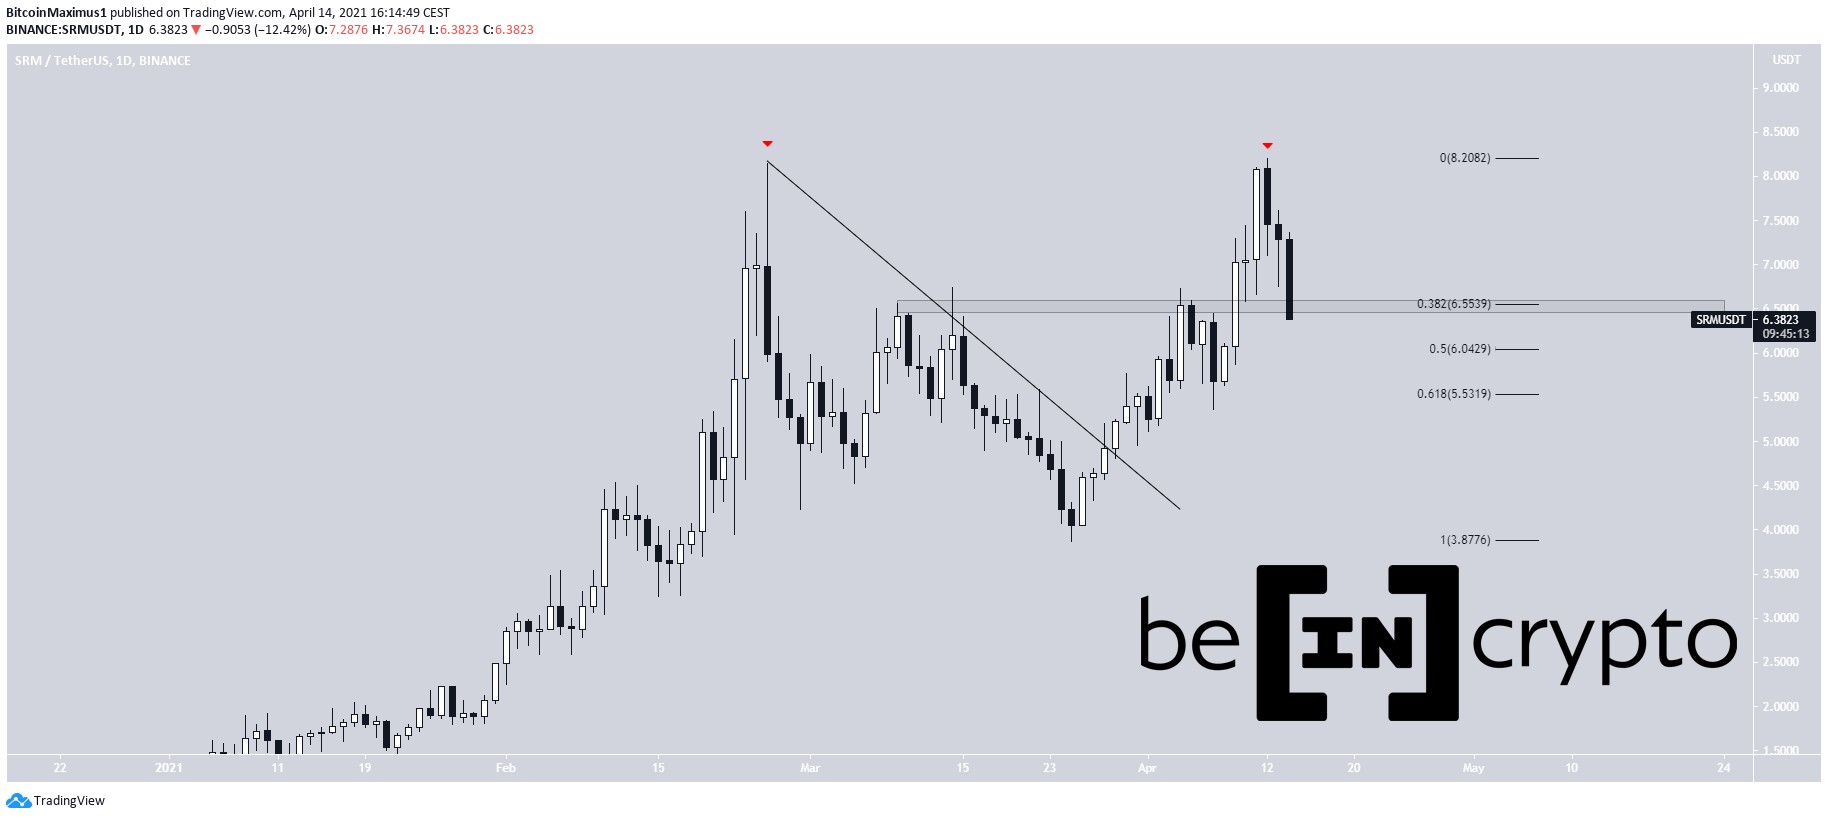
Similar to Solana, the Serum (SRM) price is trading inside a neutral pattern and is expected to continue consolidating inside of it.
Solana (SOL) Trading RangeSolana has been increasing since Nov. 5, when it reached a low of $1.22. The increase continued until a high of $2.51 was reached on Nov. 21.
This movement served to validate the $2.50 area as resistance, along with one more rejection on Nov. 25, which left a similarly long upper wick. SOL has been moving downwards since.
Technical indicators are bearish, supporting a continued downward movement. If so, the closest support area is found at $1.40.
SOL Chart By TradingViewCryptocurrency trader @altcoinsherpa outlined a chart for Solana, which she believes will move in a similar direction.
However, SOL is still trading in its range without significant movement. Due to the reasons outlined above, a decrease toward support seems like the more likely scenario.
Source: TwitterA look at a lower time-frame shows that SOL has almost reached a minor support level at $1.65. However, both the RSI and MACD are bearish, indicating that SOL is more likely to break down from this level than it is to move upwards.
A breakdown would likely take SOL towards the $1.40 support.
In addition, SOL is also following a descending resistance line. A breakout above this line would invalidate the bearish sentiment, but at present, it seems unlikely.
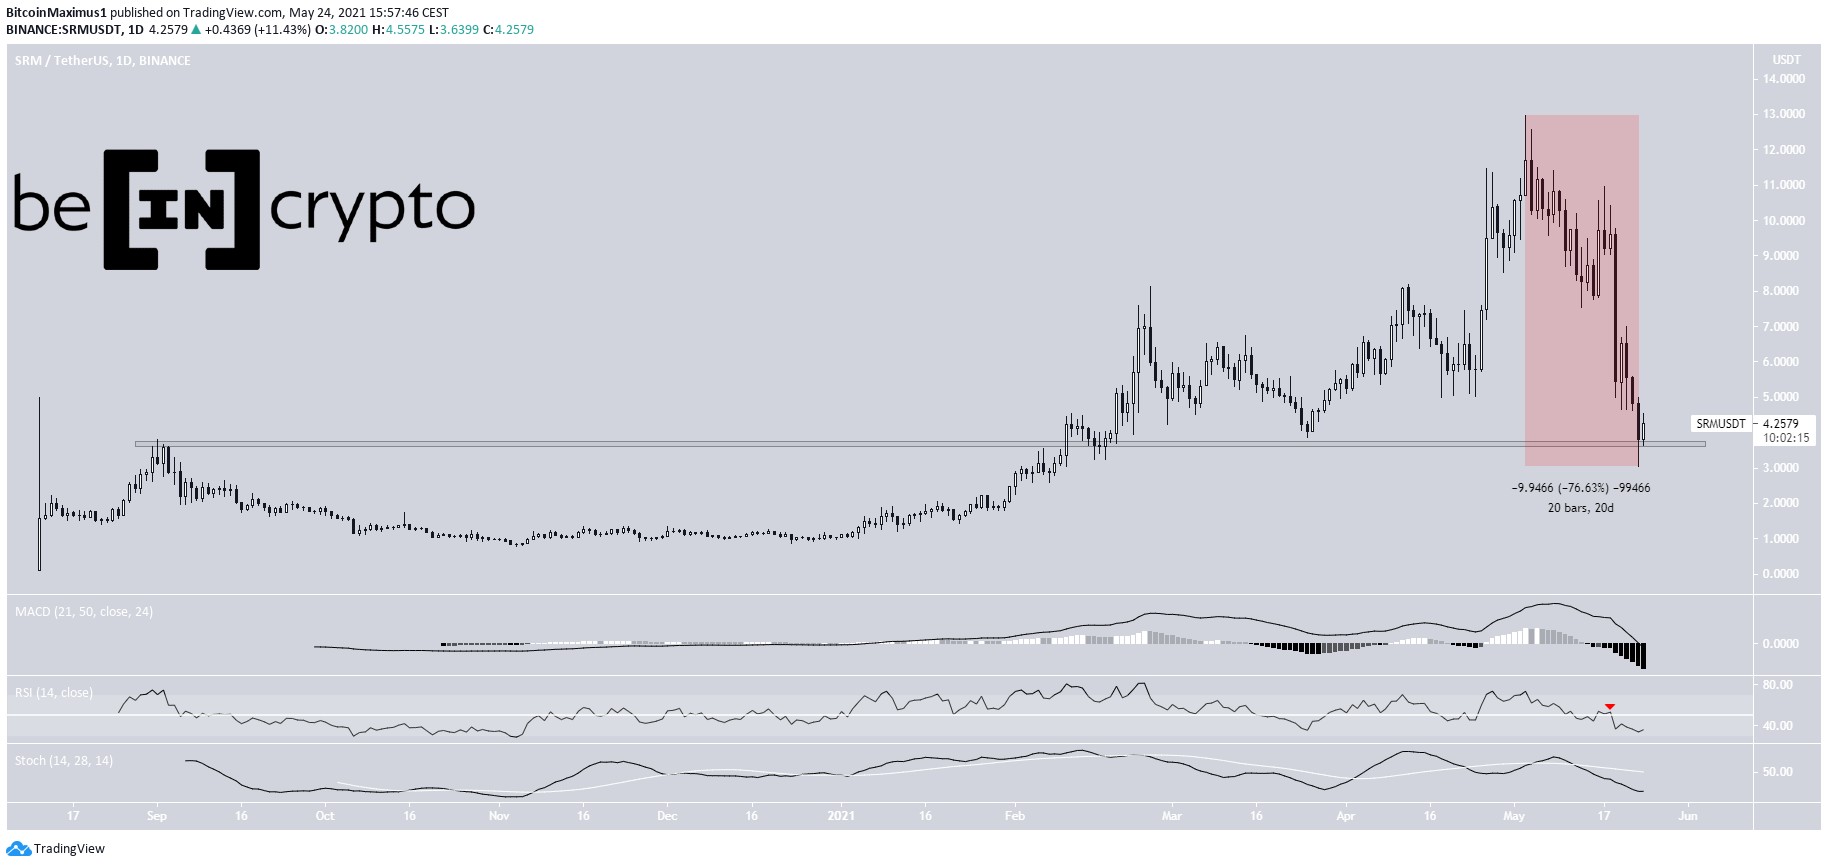
SOL Chart By TradingView Serum (SRM) OutlookSerum has been trading inside a symmetrical triangle since reaching a low of $0.79 on Nov. 4. SRM is approaching the point of convergence between resistance and support, at which point a decisive move is expected to occur.
The triangle is a neutral pattern, and technical indicators do not give a clear bias, so both a breakout or breakdown remain an even possibility.
If SRM breaks out from the triangle and increases the entire height of the pattern, it could reach the $1.70 resistance area.
On the other hand, a breakdown would likely take it toward new all-time lows.
SRM Chart By TradingView ConclusionWhile it’s possible that SRM will soon begin to move upwards, SOL may have to make another low to complete its pattern before beginning an upward movement.
For BeInCrypto’s latest Uniswap Token (UNI) analysis, click here!
Disclaimer: Cryptocurrency trading carries a high level of risk and may not be suitable for all investors. The views expressed in this article do not reflect those of BeInCrypto.
The post Solana (SOL) and Serum (SRM) Struggle to Mitigate Bearish Trends appeared first on BeInCrypto.
origin »Bitcoin price in Telegram @btc_price_every_hour
Solana (SOL) на Currencies.ru
|
|