2021-11-2 22:55 |
SHIBA INU (SHIB) reached a new all-time high price on Oct 28. Dogecoin (DOGE) has yet to move above its Aug highs but is potentially in the beginning phases of its upward movement.
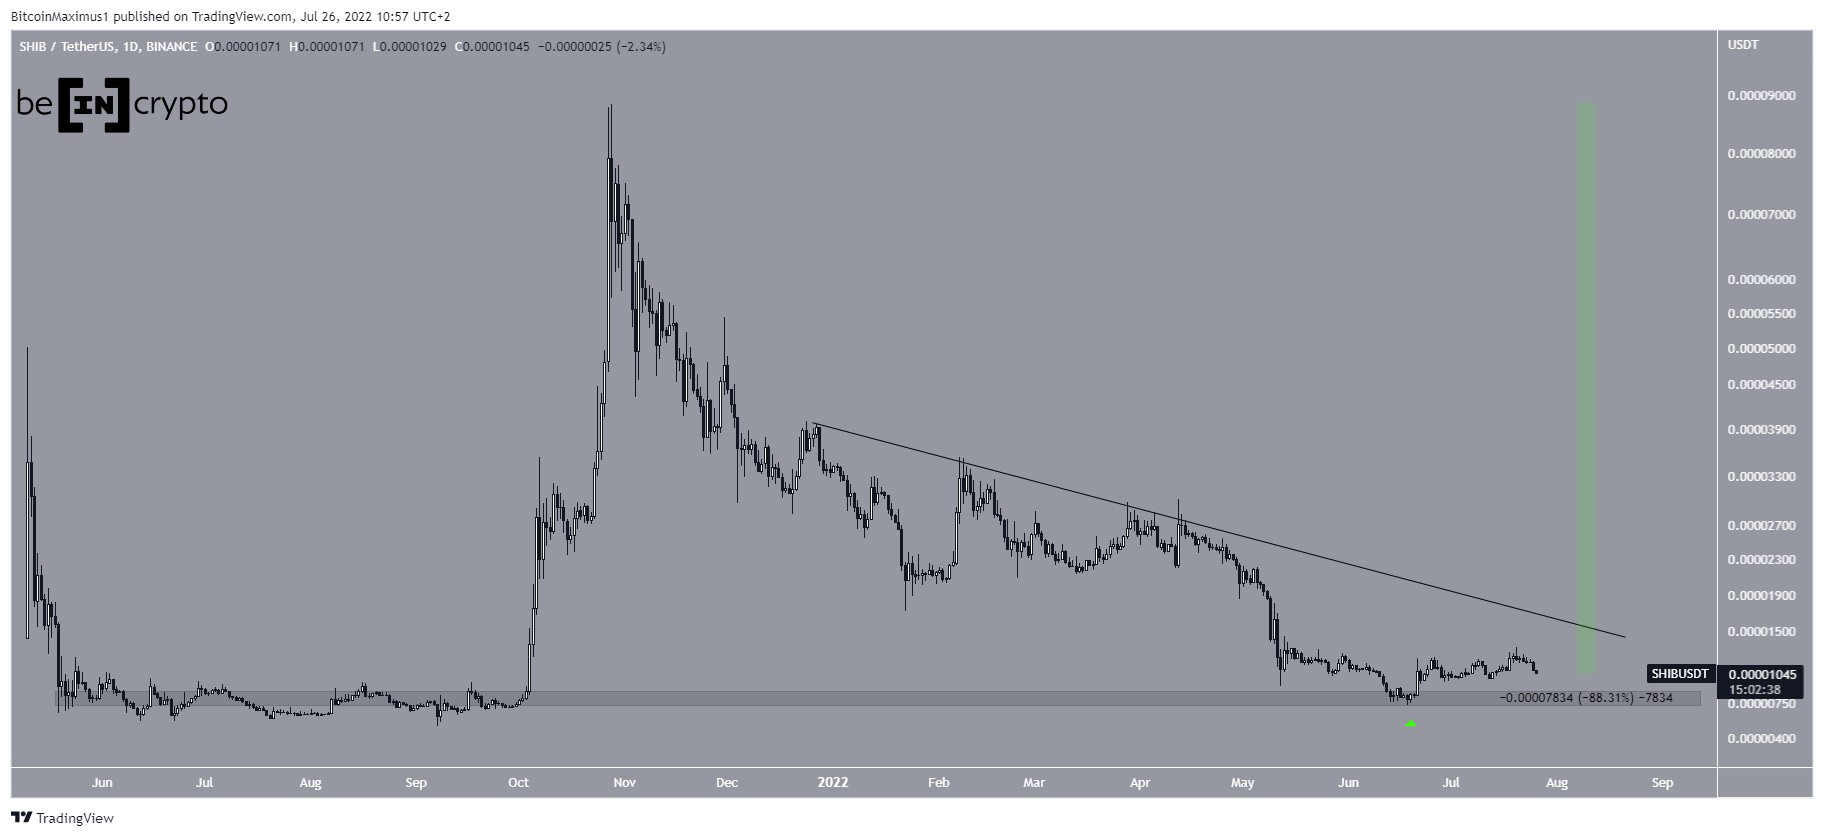
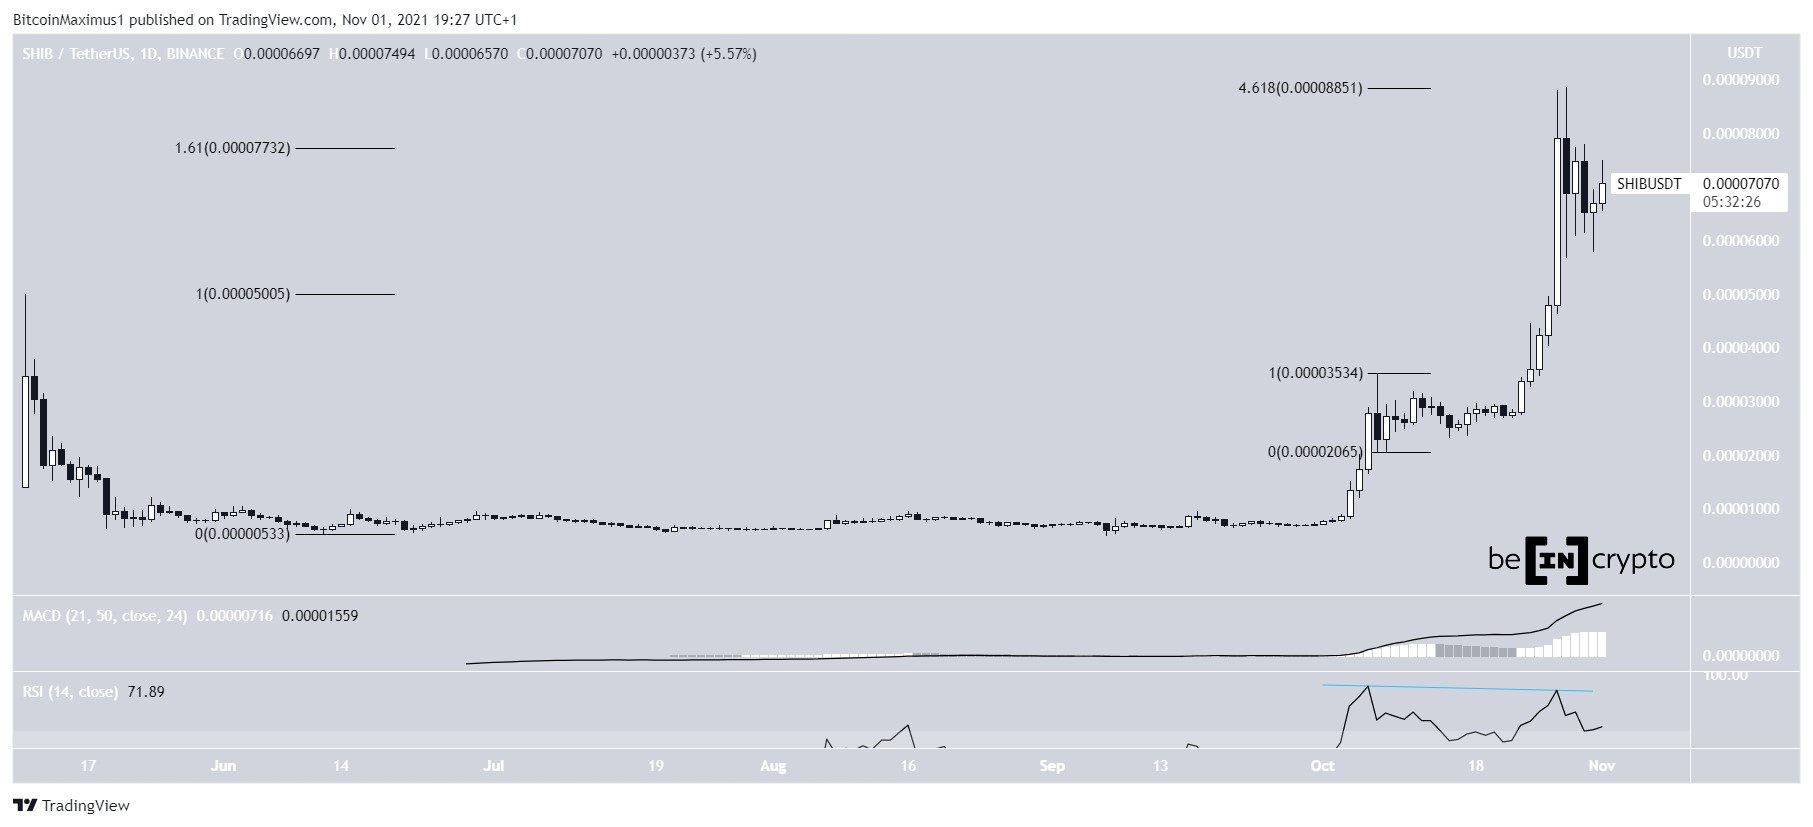
SHIB has been moving upwards at an accelerated rate since Oct 23. The upward movement continued for five days, and the token reached a new all-time high price of $0.000088.
However, SHIB has been moving downwards since. The fact that the high was made at a confluence of Fib resistance levels indicates that it is possible that a short-term top has been reached.
The high was made at the long-term 1.61 external Fib retracement level and the short-term 4.618 external Fib retracement level. Both of these often act as resistances once the price reaches a new all-time high.
In addition to this, the RSI has generated bearish divergence. This means that the increase in price has not been accompanied by an equal increase in momentum. This often leads to a price reversal.
Chart By TradingViewThe shorter-term four-hour chart shows that the token is trading inside a symmetrical triangle. While the triangle is considered a neutral pattern, it is transpiring after an upward movement. Therefore, a breakout would be the more likely option, since it would simply resume the ongoing trend.
If a breakout occurs, the next resistance would be at $0.000106. This is the 1.61 external Fib retracement resistance level when measuring the drop in the triangle.
Chart By TradingView What about DOGE?Cryptocurrency trader @Altstreetbet outlined a DOGE chart, in which the token initiates an upward movement after completing the current correction.
Source: TwitterWhile DOGE has yet to even move above its Aug highs, it has broken out from the descending resistance line in place since Aug 16. Afterwards, it validated it as support on Oct 27 and bounced, creating a bullish engulfing candlestick.
This is a type of bullish candlestick in which the entire decrease from the previous day is negated by an increase the next day.
The upward movement is also supported by technical indicator readings. Both the RSI and MACD are increasing.
The former, which is a momentum indicator, is above 50. This is a sign of a bullish trend.
The latter, which is created by a short- and a long-term moving average (MA), is positive and increasing. This is a sign of a bullish trend.
The closest resistance area is at $0.45. If DOGE manages to reclaim it, it could increase towards the all-time highs near $0.74.
Chart By TradingViewFor BeInCrypto’s previous Bitcoin (BTC) analysis, click here.
What do you think about this subject? Write to us and tell us!
The post SHIBA INU (SHIB) Reaches New All-Time High – Can Dogecoin (DOGE) Replicate? appeared first on BeInCrypto.
origin »Bitcoin price in Telegram @btc_price_every_hour
SHIBA INU (SHIB) на Currencies.ru
|
|

