2019-2-15 19:29 |
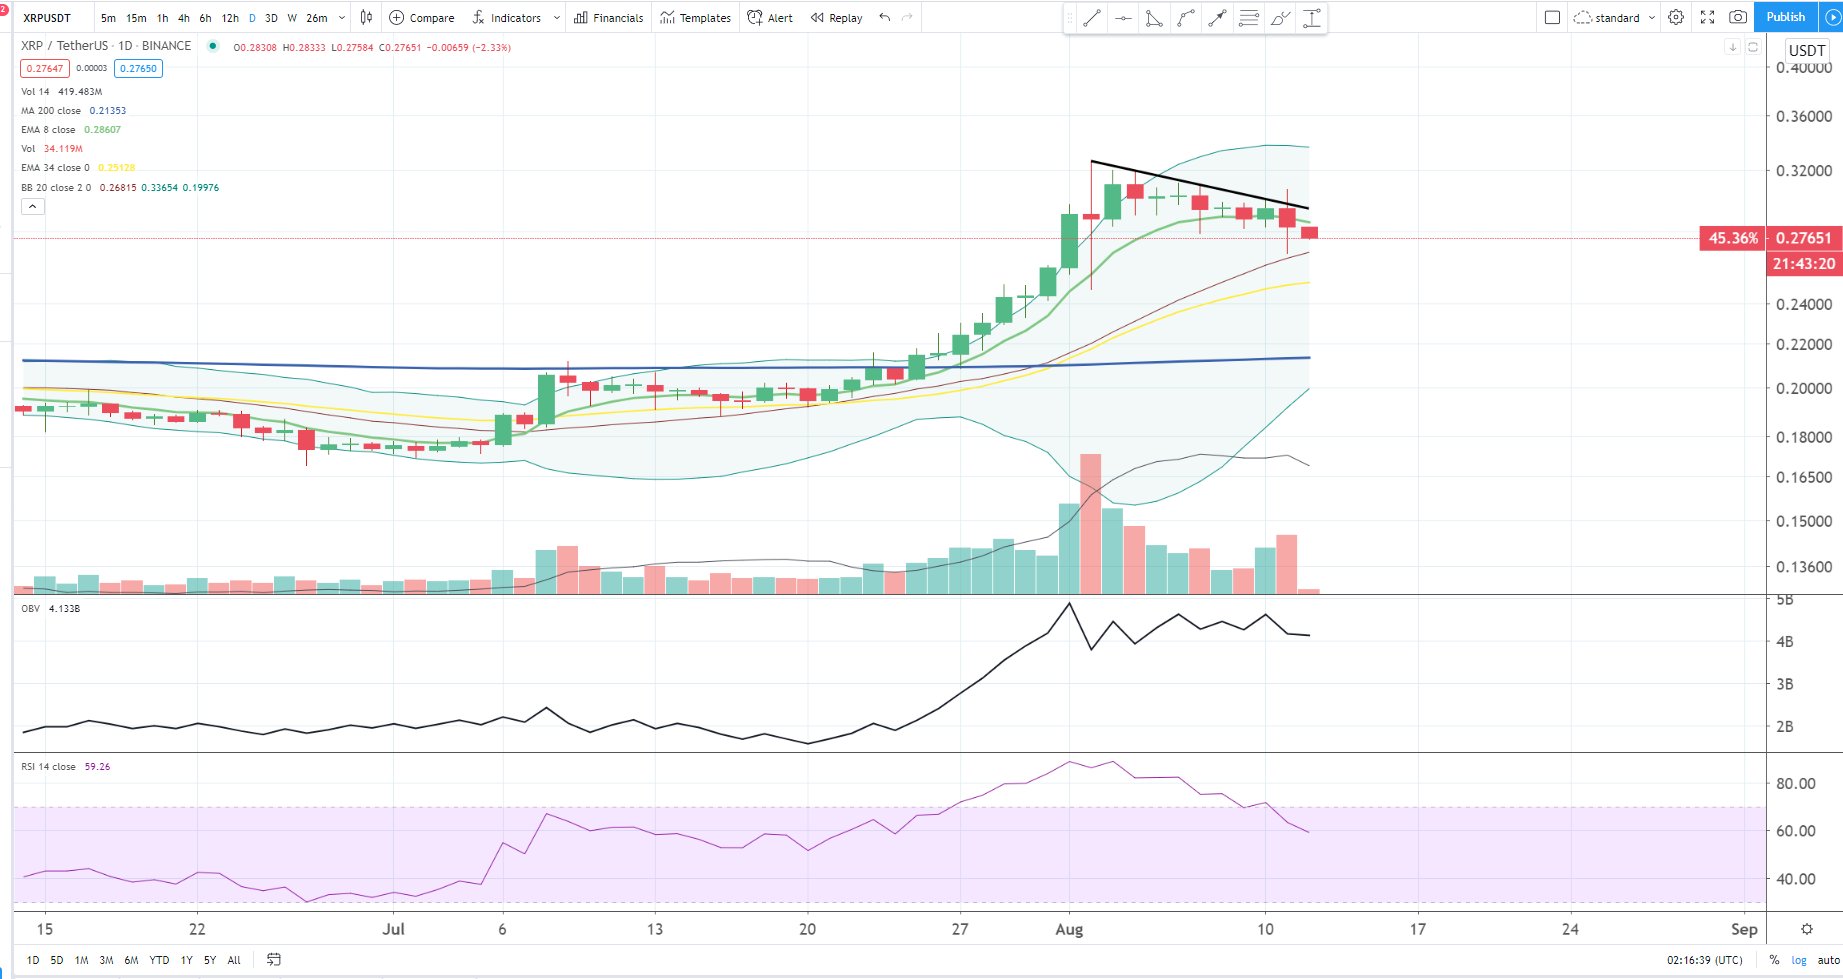
XRP Daily Chart – Source: Tradingview.com
XRP has dropped to the position of the third largest cryptocurrency by market cap after underperforming during bullish market rises last week.
The underperformance resulted in Ethereum overtaking it and reclaiming the position as the second largest cryptocurrency.
Technical patterns are not forming much better this week.
We have seen XRP continue to consolidate for a lot of the week with several Doji candles forming.
Doji candles are candles where the open and the close are around the same point and typically reflect uncertainty from traders.
Price has been forming lower highs since the end of 2018 forming a downward trend.
It has also been forming higher lows from the December low resulting in a descending triangle pattern.
With the downward trend line being significantly steeper, the pattern is more similar to a descending triangle pattern which is a bearish trend continuation pattern increasing the likelihood of bearish movements going forward.
XRP 4-Hour Chart – Source: Tradingview.comPrice has been trading between two key levels.
If the bearish trend continuation pattern plays out, there is an important weekly support level below the price at $0.286.
If price can manage to break above the downward trend, the key resistance level to monitor is $0.311.
Tron Daily Chart – Source: Tradingview.comSimilarly, Tron has also been forming bearish price patterns as seller momentum increases.
Tron had been outperforming over the past few weeks but failed to stay above the resistance level at $0.028.
$0.028 is the point was a point of buyer liquidity during bearish declines in August.
After several attempts at rising above $0.028 and failing, the price has since started trading downwards.
Momentum is on the side of sellers as indicated by a decreasing RSI.
The next key support level to monitor is $0.0233 which is just below where price is currently trading.
$0.0233 acted as a second point of buyer liquidity during the bearish declines in August and has since acted both as an important support and resistance level.
Tron 4-Hour Chart – Source: Tradingview.comSimilar to XRP, Tron has been forming a bearish trend continuation pattern.
A descending triangle has been forming between support at $0.023 and the downward trendline which has formed since price failed to surpass $0.028.
Key Takeaways: Bearish price prospects for both XRP and Tron as both form bearish trend continuation patterns. Key levels to monitor for XRP are $0.286 as support and $0.311 as resistance. Key levels to monitor for Tron are $0.023 as support and the downward trendline and $0.028 as resistance. Latest Ripple and Tron News:European Parliament Member Discusses Crypto Regulations at Ripple Regionals
TRON Foundation Joins Awareness Campaign to Find Treatments and Cure for ALS, Sun Donates $250,000
DISCLAIMER: Investing or trading in digital assets, such as those featured here, is extremely speculative and carries substantial risk. This analysis should not be considered investment advice, use it for informational purposes only. Historical performance of the assets discussed is not indicative of future performance. Statements, analysis, and information on blokt and associated or linked sites do not necessarily match the opinion of blokt. This analysis should not be interpreted as advice to buy, sell or hold and should not be taken as an endorsement or recommendation of a particular asset.Ripple/XRP and Tron [TRX]: Bearish Price Prospects Ahead for Both Coins? was originally found on Cryptocurrency News | Blockchain News | Bitcoin News | blokt.com.
origin »Bitcoin price in Telegram @btc_price_every_hour
Ripple (XRP) на Currencies.ru
|
|


