2022-6-4 00:00 |
While Reserve Rights (RSR) has been moving upwards since May 12, the upward movement so far looks corrective. Additionally, the price has yet to break out from a long-term pattern.
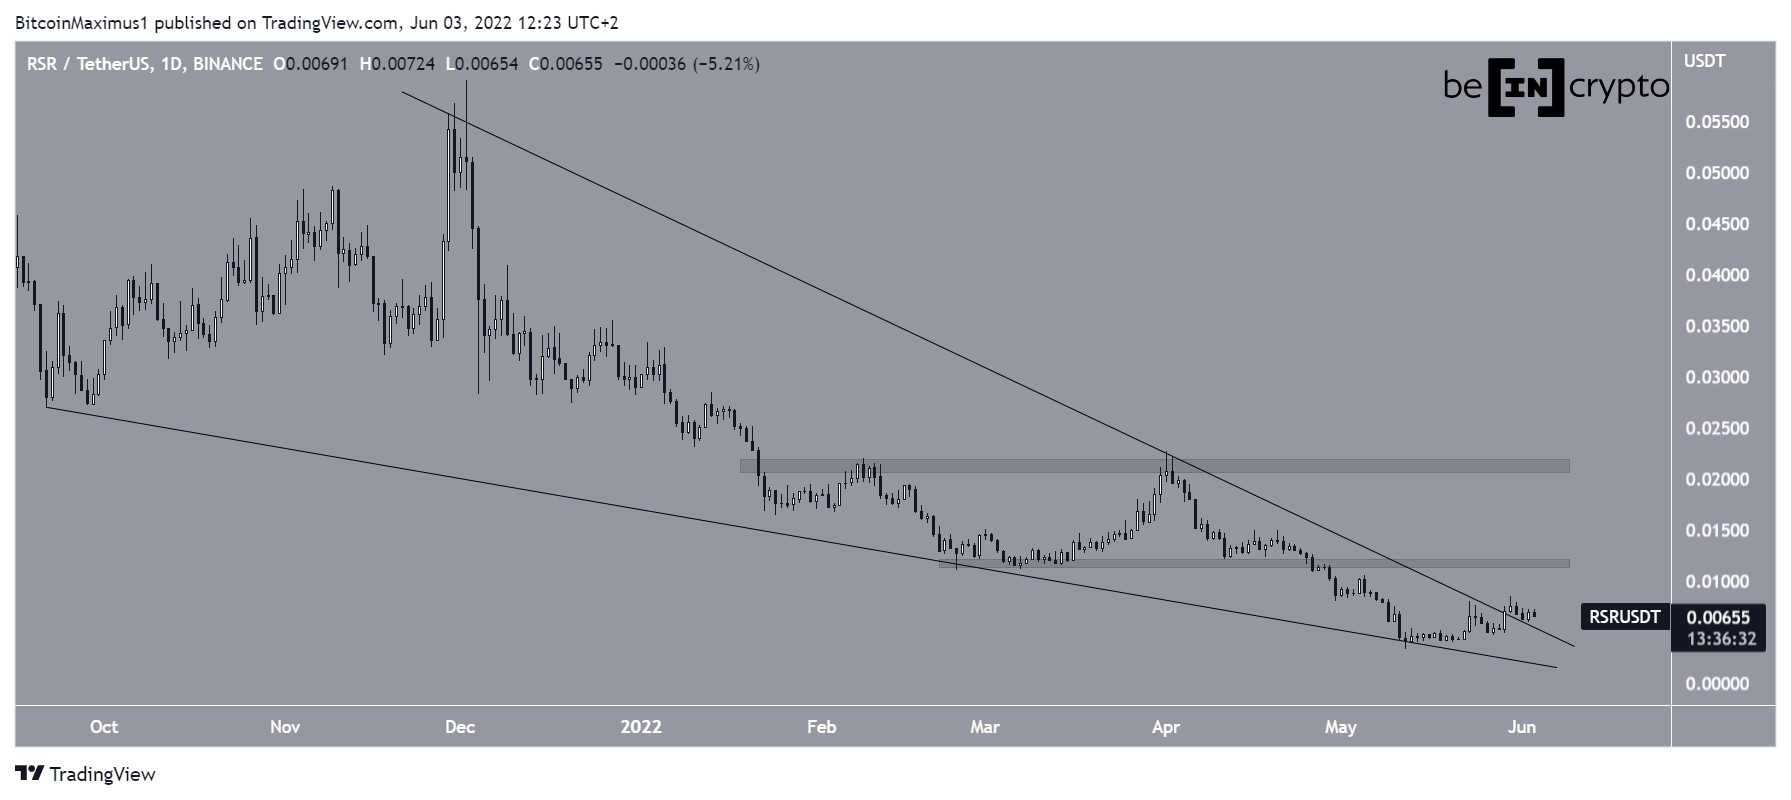
RSR has been decreasing underneath a descending wedge since Sept. 2021. The downward movement has so far led to a low of $0.033 on May 12, 2022.
The price has been moving upwards since, and seemingly broke out from the wedge on May 30. However, due to the presence of numerous long upper wicks, the exact slope of the resistance line cannot be confidently determined, so it is possible that the price is trading just below it.
If the upward movement continues, the closest resistance area would be at $0.0115, The area had previously acted as support in March 2020. Afterward, the next closest resistance area would be at $0.0215.
RSR/USDT Chart By TradingView Ongoing bounceThe upward movement since May 12 can be contained inside an ascending parallel channel. Such channels usually contain corrective movements, meaning that an eventual breakdown from it would be likely.
Both the RSI and the price movement support this interpretation. The price has fallen below the middle of the channel, while the RSI is at risk of breaking down from its ascending support line.
A breakdown from the channel would likely cause an acceleration of the rate of decrease.
RSR/USDT Chart By TradingView RSR wave count analysisThe wave count suggests that the price has been decreasing inside a five wave downward movement (black) since Aug. 2021. If so, it is currently in wave five.
The sub-wave count is given in yellow, also suggesting that the price is in sub-wave five.
This means that the ensuing decrease will be the final one prior to a very significant rebound.
RSR/USDT Chart By TradingViewFor Be[in]Crypto’s latest bitcoin (BTC) analysis, click here
The post Reserve Rights (RSR) Doubles in Price After May 12 Lows appeared first on BeInCrypto.
origin »Bitcoin price in Telegram @btc_price_every_hour
ETH/LINK Price Action Candlestick Set (LINKETHPA) на Currencies.ru
|
|


