2022-9-27 19:00 |
By examining specific metrics, on-chain research published on Aug. 21 suggested that the Bitcoin bottom was close but not in yet.
Revisiting these metrics a month later shows it is all changed. However, investors should be aware that this does not necessarily mean the price of Bitcoin cannot fall further from current prices.
Percentage of Bitcoin addresses in profitThe percentage of Bitcoin addresses in profit refers to the proportion of unique addresses whose funds have an average buy price lower than the current price.
In previous bear markets, the percentage of Bitcoin addresses in profit had always dropped below 50%, with last month’s reading hovering around 55%.
The updated chart below shows the percentage of addresses in profit is now below the 50% threshold, giving a current reading of approximately 48% in profit.
However, as noted in the 2015 bear market, when this metric dipped as low as 30%, there is every possibility that investor capitulation can continue for many months before this is reflected in a price trend reversal.
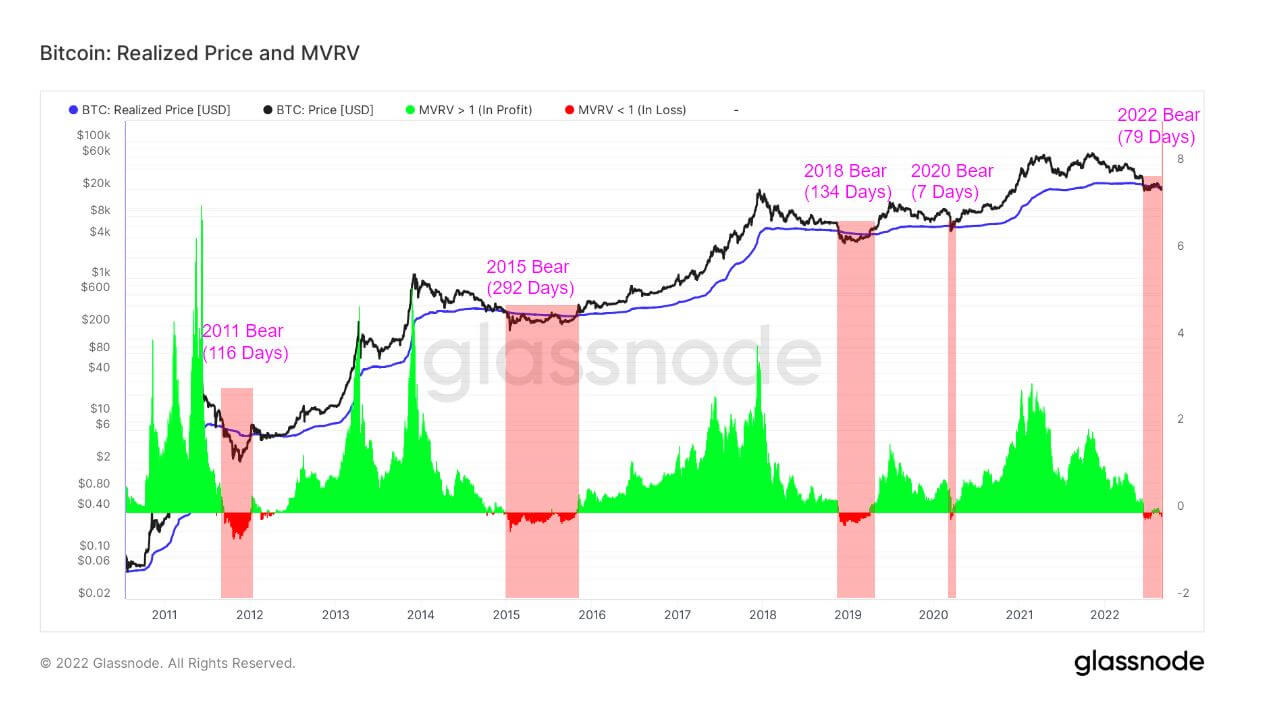
Source: Glassnode.com Market Value to Realized ValueMarket Value to Realized Value (MVRV) refers to the ratio between the market cap (or market value) and realized cap (or the value stored). By collating this information, MVRV indicates when the Bitcoin price is trading above or below “fair value.”
MVRV is further split by long-term and short-term holders, with Long-Term Holder MVRV (LTH-MVRV) referring to unspent transaction outputs with a lifespan of at least 155 days, and Short-Term Holder MVRV (STH-MVRV) equating to unspent transaction lifespans of 154 days and below.
Previous cycle bottoms were characterized by a convergence of the STH-MVRV and LTH-MVRV lines. This intersection has now occurred, suggesting long-term holder capitulation has been reached.
Source: Glassnode.com Supply in Profit and LossBy analyzing the number of BTC tokens whose price was lower or higher than the current price when last moved, the Supply in Profit and Loss (SPL) metric shows the circulating supply in profit and loss.
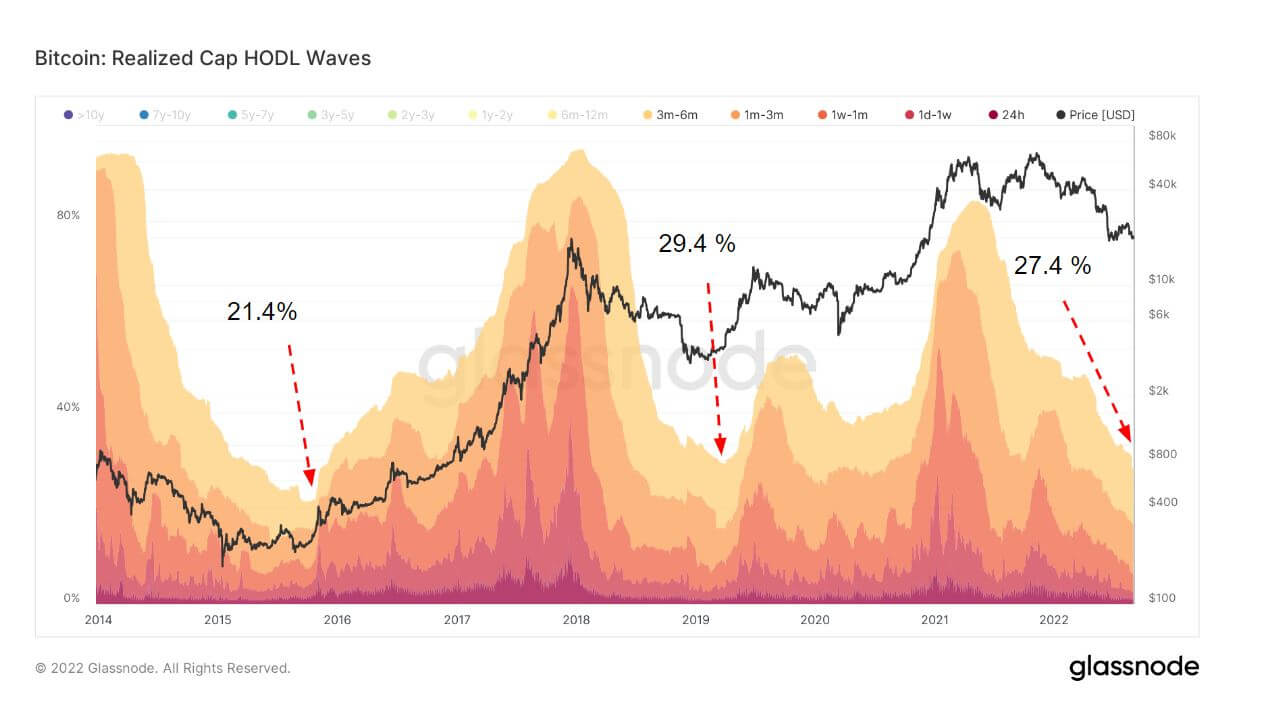
Market cycle bottoms coincide with the supply in profit and supply in loss lines converging. The chart below shows this phenomenon has occurred, meaning the majority of the circulating supply is at a loss.
Source: Glassnode.comAlthough the above metrics have flashed the bottom is in, it is important to realize that bottoming can extend over months.
In addition, the macro landscape remains an unknown factor that was not present in previous instances of bear-to-bull flips.
The post Research: Bitcoin on-chain metrics suggest bottom is now in appeared first on CryptoSlate.
origin »Bitcoin price in Telegram @btc_price_every_hour
Bitcoin (BTC) íà Currencies.ru
|
|


