2023-11-30 15:00 |
The XRP price has been treading water in recent days. After XRP rose by more than 52% in just 18 days from mid-October to early November, the price is currently in a clear consolidation phase in the shorter time frames. However, a look at the 1-month chart of the XRP/USD trading pair shows that the XRP price has exhibited strong bullish months.
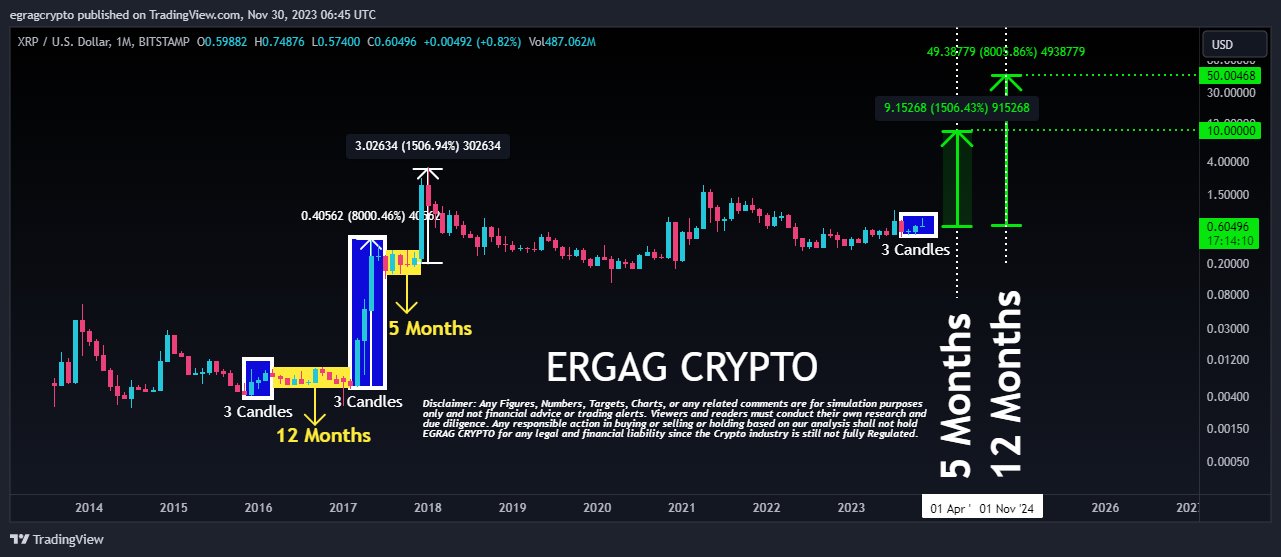
In this sense, Crypto analyst Egrag has drawn attention to an extremely rare phenomenon in the XRP monthly price chart. The pattern in question is a series of three consecutive monthly green candles, which have only been documented twice in the history of the cryptocurrency.
As the market approaches the monthly close today, a confirmation by a close above $0.5987 could mean the third monthly green candle for XRP. “Get ready—within the next [few] hours, we’re poised to seal another trio of consecutive green candles,” Egrag noted.
Here’s What This Could Mean For XRP PriceDelving into the specifics, Egrag elucidates two distinct historical precedents post such formations. In the first scenario, a 5-month consolidation phase was observed after XRP recorded three consecutive green candles from March to May 2017.
However, the consolidation phase had an extremely bullish effect. After it ended, the XRP price experienced a staggering 1,500% surge within just two months. Egrag suggests that if XRP’s price action were to emulate this historical pattern, investors can anticipate a potential surge to $10, starting from the 1st of April 2024.
The second instance Egrag refers to the period from December 2015 to February 2016. During this time, the price rose by approximately 102% in three consecutive green months. What followed was a lengthier 12-month consolidation phase. But the wait was worth it again.
In March 2018, the XRP price started an extraordinary 8,000% rally. A replication of this scenario would imply a potential skyrocketing of XRP’s price to $50, beginning on the 1st of November 2024.
Notably, Egrag offers an average price target standing at $30. He stated, “XRP army stay steady, the average of these two targets lands at $30, you know that I always whisper to you my secret target of $27. Hallelujah, the anticipation is palpable!”
Price Analysis: 1-Day ChartAt press time, XRP was trading at $0.60333. A week ago, the price managed to break out of a downtrend channel. However, the bullish momentum quickly fizzled out after the price was rejected at the 0.382 Fibonacci retracement level at $0.627.
Related Reading: Bitcoin Decouples with XRP, BNB But Correlates With Dogecoin and Cardano
For four days now, the XRP price has been squeezed into a tight range between the 20-day and 50-day EMA (Exponential Moving Average), with a breakout to the downside or upside getting closer and closer. In the event of an upside breakout, the price level at $0.627 would be decisive. Then, the price could tackle the 0.5 Fibonacci retracement level at $0.688.
However, if a breakout to the downside happens, a 100-day EMA at $0.575 would be the first support. This must hold to prevent the price from falling towards the 0.236 Fibonacci retracement level at $0.552, which is also close to the 200-day EMA. The convergence of both indicators signifies a price level that the bulls must defend at all costs.
origin »Bitcoin price in Telegram @btc_price_every_hour
Ripple (XRP) на Currencies.ru
|
|


