фото показано с : cointelegraph.com
2021-5-14 22:51 |
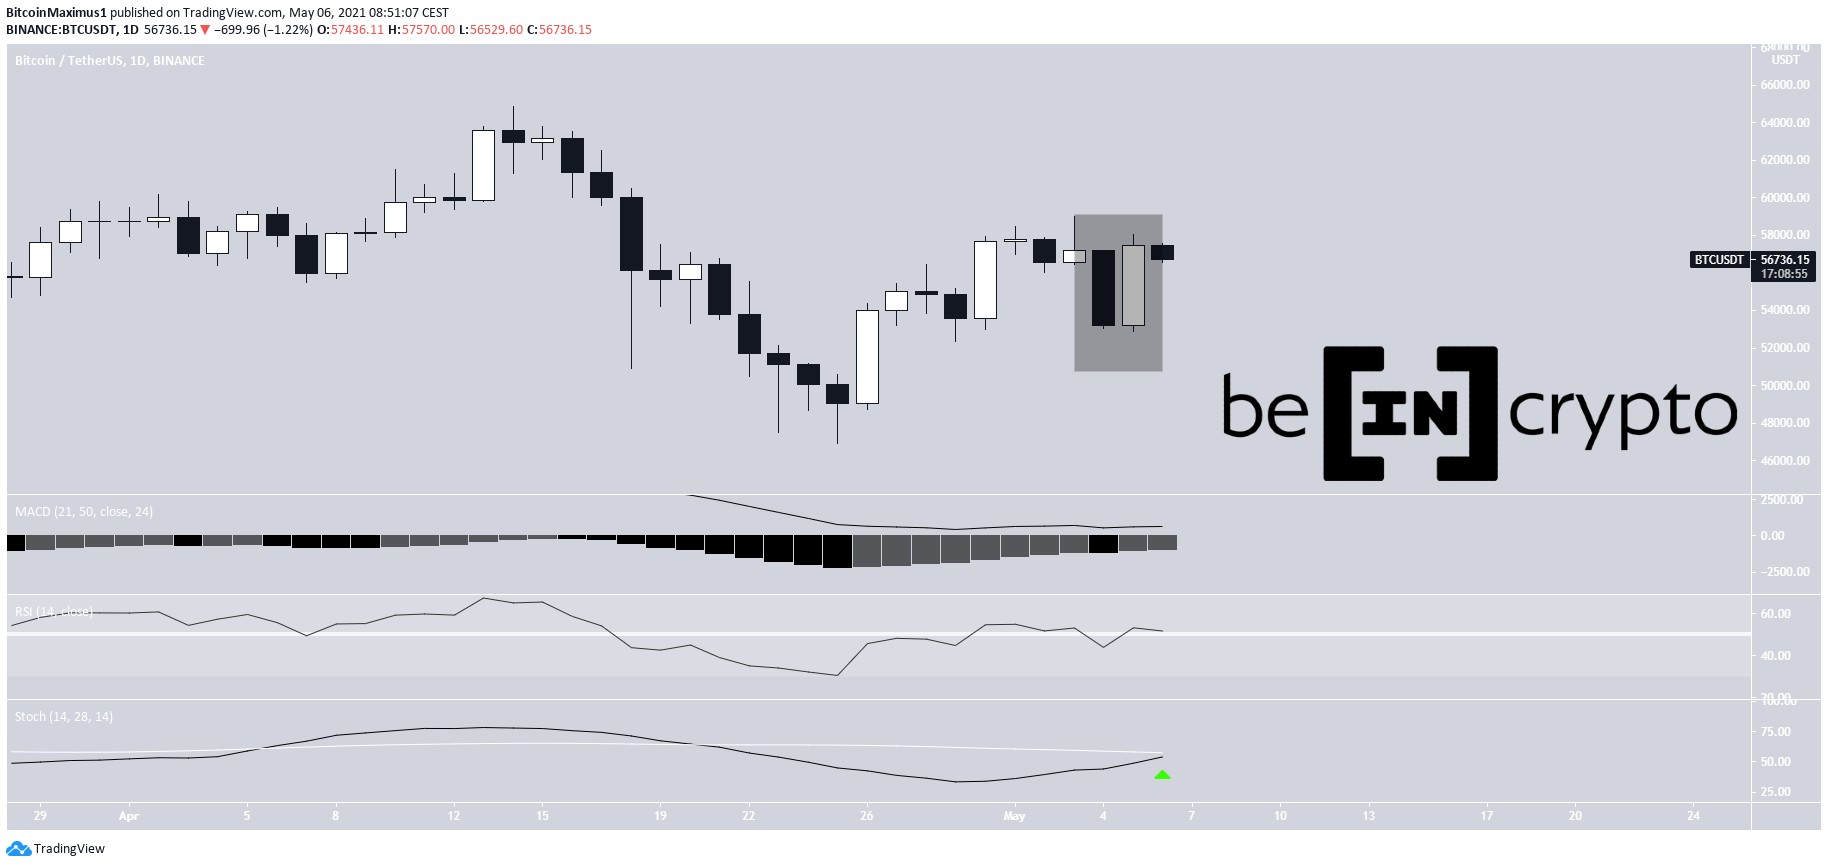
Bitcoin remains on slippery ground and the completion of a bearish candlestick pattern signals that further downside is possible for BTC and altcoins. origin »
Bitcoin price in Telegram @btc_price_every_hour
Bitcoin (BTC) на Currencies.ru
$ 76318.29 (+0.05% )
Объем 24H $32.198b
Изменеия 24h: -1.28 % , 7d: -0.05 %
Cегодня L: $76217.26 - H: $76463.2
Капитализация $1528.051b Rank 1
Цена в час новости $ 51294.85 (48.78% )
|
|