2024-9-26 21:15 |
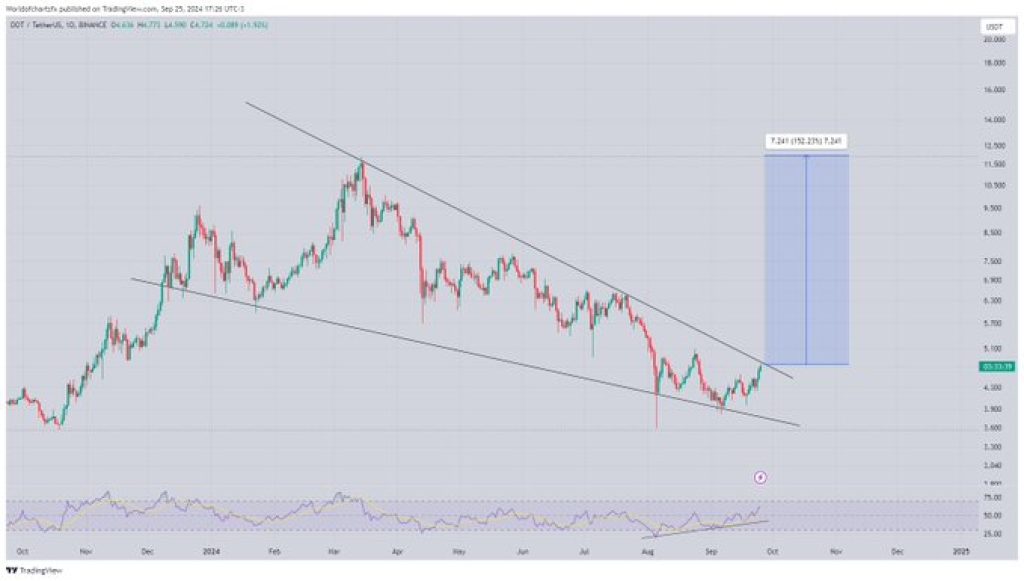
World of Charts, a top analyst, reported on X (formerly Twitter) that Polkadot (DOT) is showing signs of reversal after a six-month corrective phase. He added that the formation of a falling wedge pattern, coupled with pronounced bullish divergence on key indicators, suggests a high probability of a successful breakout.
The analyst pointed out that upon confirmation, a compelling buying opportunity will occur soon as DOT’s price may target the $12 level in the near term.
Polkadot Technical Analysis: Falling Wedge Pattern and Key IndicatorsWorld of Charts DOT analysis reveals a well-defined falling wedge pattern, a bullish reversal signal, formed after a six-month correction. The price is approaching a critical resistance level as it interacts with a descending trendline.
Moreover, several short-term bullish breakouts have been observed, indicating increasing momentum for a potential breakout.
Image Source: X/WorldofChartsThe exponential moving average (EMA) shows the price testing dynamic resistance, while the RSI (Relative Strength Index) is positioned at 60.57, a level that favors a bullish bias. This growing momentum is supported by a slight uptick in trading volume, further hinting that DOT’s price could soon break above the wedge pattern.
.rh-colortitlebox{margin-bottom:30px;background:#fff;line-height:24px;font-size:90%}.rh-colortitlebox .rh-colortitle-inbox{display:flex;align-content:center;padding:15px;font-weight:700;font-size:110%; line-height:25px}.rh-colortitlebox .rh-colortitle-inbox i{line-height:25px; margin:0 10px; font-size:23px}.rh-colortitlebox .rh-colortitle-inbox svg{width:25px;margin-right:10px}.rh-colortitlebox .rh-colortitle-inbox-label{flex-grow:1}.rh-colortitlebox .rh-colortitlebox-text{padding:20px}.rh-colortitlebox-text>*{margin-bottom:20px}.rh-colortitlebox-text>:last-child{margin-bottom:0} Celebrate Dogecoin and Make Big Gains with Doge2014!.rh-toggler-open{height:auto !important} .rh-toggler-open .rh-tgl-show, .rh-toggler-open .rh-tgl-grad{display:none !important} .rh-toggler-open .rh-tgl-hide{display:block !important} .rh-tgl-show, .rh-tgl-hide{cursor:pointer} .rh-contenttoggler *{box-sizing: border-box !important} .rh-toggler-wrapper{overflow: hidden;transition: all 0.5s ease; padding-bottom: 35px; margin-bottom:30px;box-sizing: content-box !important;position: relative;} .rh-toggler-wrapper p:last-of-type {margin-bottom: 0;}Doge2014 raises 500K in days celebrating Dogecoin. Make potentially big profits and get in on exclusive airdrop!
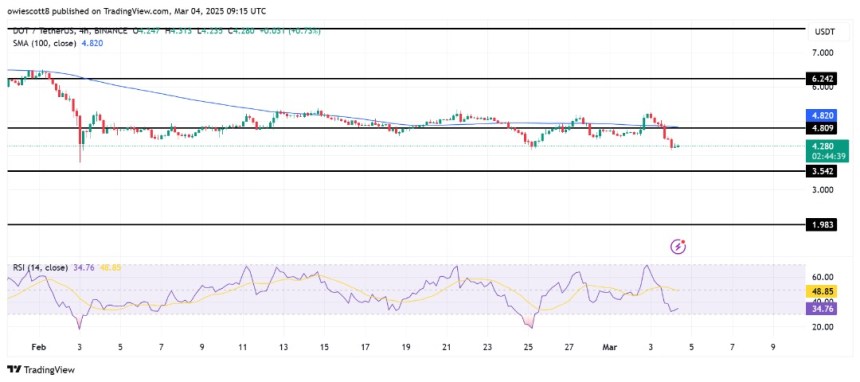
Show more +Show less – RSI Divergence and Breakout PotentialScoottMelker, another famous analyst, shared a DOT chart on TradingView, indicating the presence of bullish divergence between the price and RSI. While the price has made lower lows, the RSI has made higher lows, a strong indicator that the downward trend may be losing steam.
Image Source: TradingView/ScottMelkerThis divergence often signals an upcoming reversal, supporting the bullish outlook for Polkadot. Should DOT’s price break through the descending resistance line of the falling wedge, the analyst predicts that the price could fly.
Furthermore, World of Charts has projected a potential upside of up to $12, which represents a 125% increase from its current levels.
Read Also: Here’s Why Shiba Inu (SHIB) Meme Coin Price Is Pumping
Analyst Insights and Polkadot’s Market ConditionsScott Melker emphasized that while the pattern has not yet confirmed a breakout, the token is approaching a key moment. The analyst urges traders to wait for the price to decisively break above the resistance on the higher volume before considering a long position.
Trading Alpha has also indicated signs of momentum, with indicators pointing toward a heating market. However, as with Melker’s analysis, a breakout confirmation is key to validating the upward move.
While DOT is showing strong bullish potential, experts advise caution. The current market setup appears promising, but it’s important to wait for the breakout to materialize with sufficient volume.
A close above the $5 range could be the first signal of a true reversal, providing traders with a buying opportunity. Until then, market participants should stay patient and monitor the price action closely. Moreover, if the breakout occurs, Polkadot could be on its way to reclaiming higher levels, with $12 in sight.
Follow us on X (Twitter), CoinMarketCap and Binance Square for more daily crypto updates.
Get all our future calls by joining our FREE Telegram group.
Engaging community with games and crypto incentives
Integrated platform with GameFi and NFT functionalities
Simple interface that’s easy for new users to explore crypto gaming
The post Polkadot’s DOT Price Approaches Key Resistance—Is a Breakout to $12 Possible? appeared first on CaptainAltcoin.
origin »Bitcoin price in Telegram @btc_price_every_hour
Polkadot [IOU] (DOT) на Currencies.ru
|
|