2024-9-13 19:17 |
Polkadot (DOT) is currently navigating a period of heightened volatility, as the cryptocurrency finds itself at a critical juncture in its price action.
After showing signs of recovery from its multi-year low, Polkadot’s bullish momentum has weakened, with renewed bearish pressure steering its price toward the key support level of $3.5.
The asset, once trading near $5, is now grappling with selling pressure that could push it even lower if buyers fail to defend crucial levels.
Failed Polkadot recovery attemptIn recent weeks, Polkadot attempted a recovery, briefly climbing to $5.11 on August 24.
However, the relief rally was short-lived, as sellers regained control of the market, causing DOT to slip below its 20-day Simple Moving Average (SMA) by August 26.
This dynamic level of resistance has proven challenging for buyers to overcome, stalling DOT’s upward movement.
As of today, DOT is trading around $4.224, reflecting a 3.20% decline with a market capitalization of $6 billion.
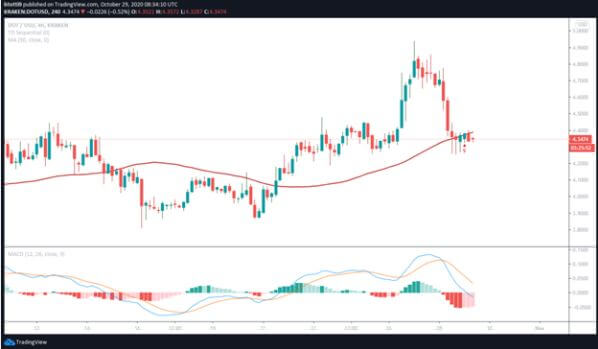
Source: TradingView
The 20-day SMA resistance levelThe 20-day SMA continues to act as a critical resistance level, capping Polkadot’s recovery attempts.
Failure to break above this level indicates that bearish momentum is strong, especially with the Relative Strength Index (RSI) hovering below 50% on both the 4-hour and daily charts.
The RSI currently sits around 44% on the daily chart, reinforcing the notion that sellers remain dominant.
A key area of support lies at $3.62, Polkadot’s multi-year low, tested in early August.
This level is crucial for buyers to defend if the asset is to avoid further downside toward $3.5.
Additionally, $4 remains another vital support level that has been retested several times.
Should Polkadot lose this level, the $3.5 zone will come into focus, potentially opening the door for a steeper decline toward $1.9.
Conversely, despite the bearish pressure, there are potential scenarios for recovery.
If buyers successfully defend the $3.62 and $4 support levels, a rebound toward $4.50 is possible.
Breaking through the 20-day SMA would strengthen the bullish case, with further upside targeting $5 and possibly higher levels like $6.2.
Some positive developments that could spur Polkadot’s price surge include the recent launch of The Tie’s Polkadot Ecosystem Dashboard.
This tool provides institutional investors with detailed analytics, including transaction metrics, token supply, and Total Value Locked (TVL) across parachains, giving traders and investors deeper insights into the network’s performance.
Ultimately, Polkadot’s price movement hinges on how market participants react to these key levels.
As the market watches closely, the next few weeks could determine whether DOT stabilizes or continues its downward slide.
The post Polkadot price struggles amid bearish momentum: key levels to watch appeared first on Invezz
origin »Bitcoin price in Telegram @btc_price_every_hour
Polkadot [IOU] (DOT) на Currencies.ru
|
|


