2024-6-27 12:30 |
Polkadot’s (DOT) price trajectory has comprised noticeable shifts in the current crypto market. Various experts, including The Cryptomist and Planfomo, have shared their insights. Moreover, they predict potential bullish trends against a backdrop of significant resistance levels.
Expert Insights and Predictive DOT AnalysisThe Cryptomist shared their insights on Polkadot (DOT), highlighting profits from an earlier post. They mentioned taking precautions by securing profits while waiting for a 4-hour bullish divergence on Bitcoin. According to them, Polkadot is primed for significant movement once Bitcoin stabilizes or finds its bottom.
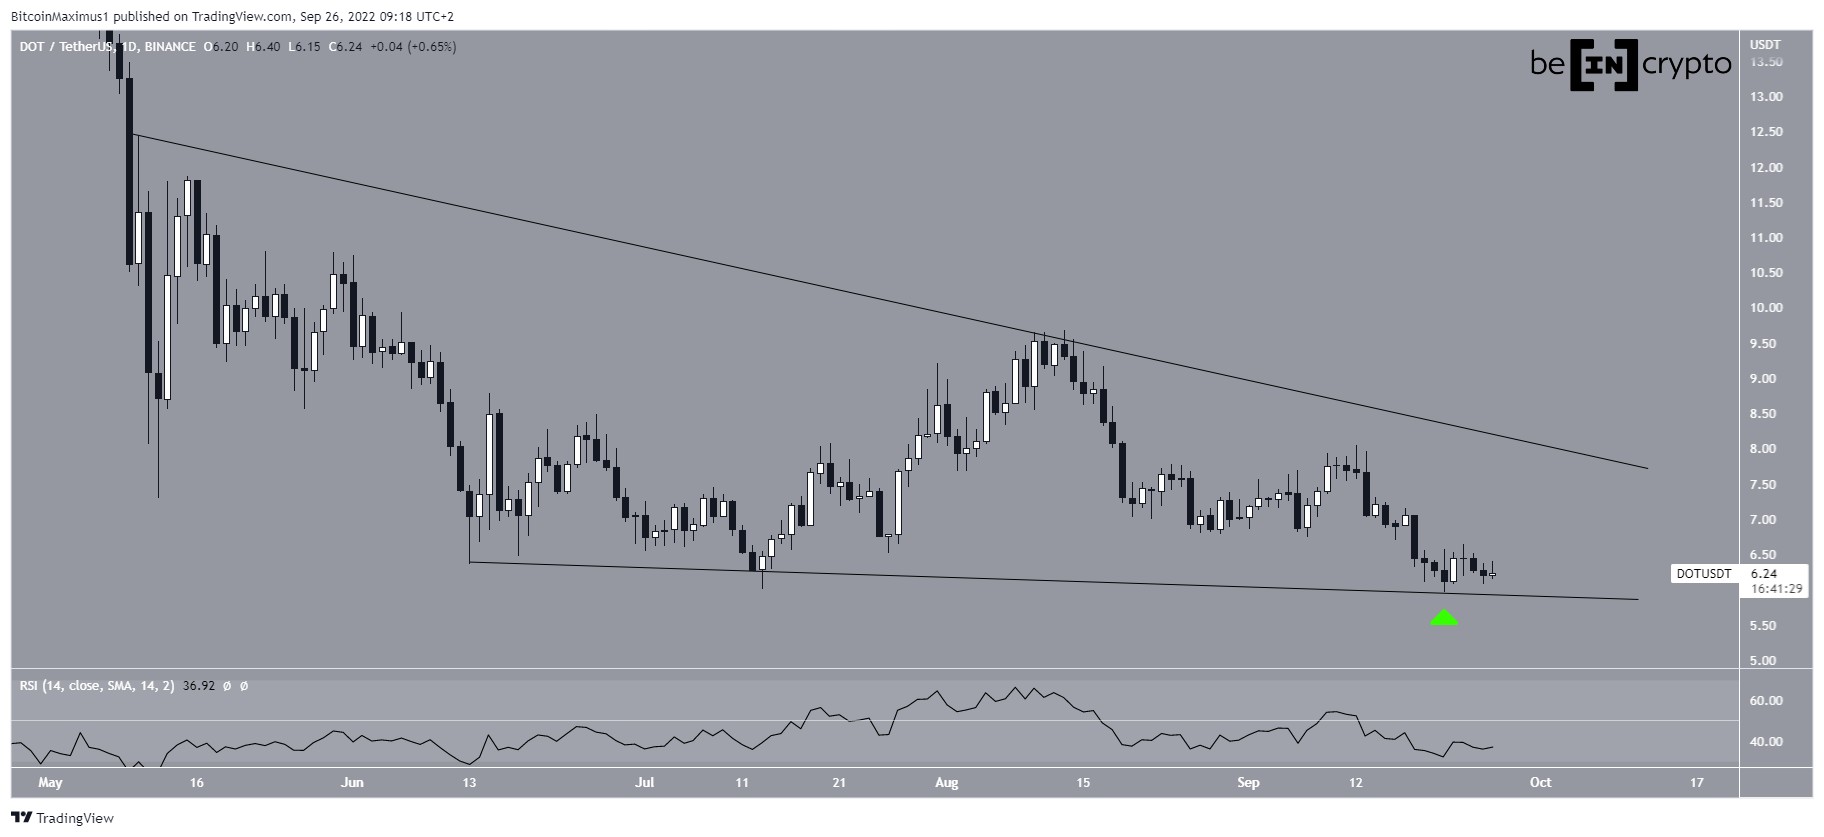
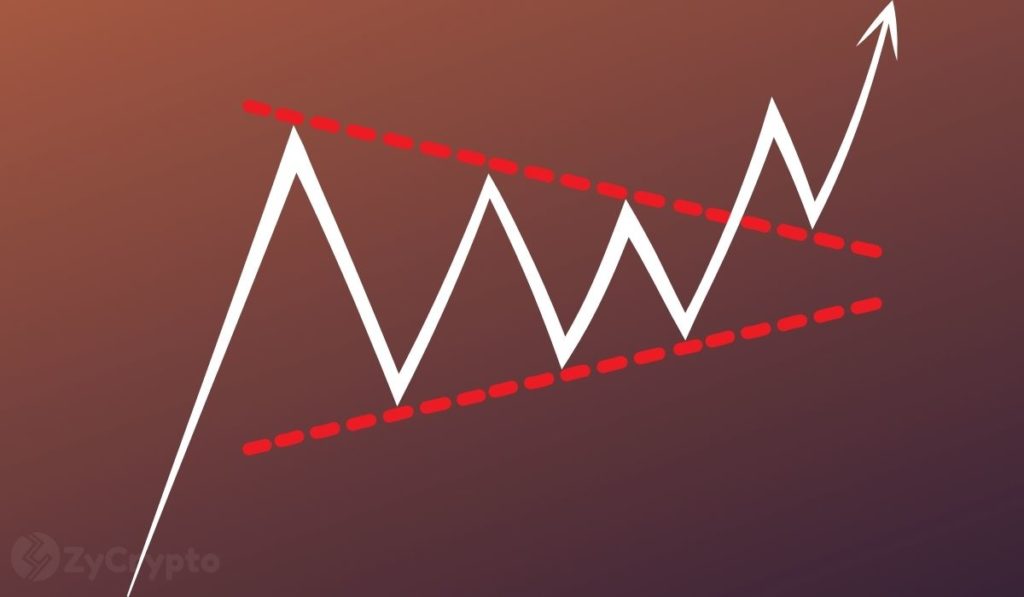
Analyst Planfomo also provided analysis on Polkadot, noting that it has been overlooked. They observed that DOT found some support and formed a potential falling wedge pattern on the daily timeframe. They believe a breakout could lead to a full send, emphasizing the importance of this technical formation.
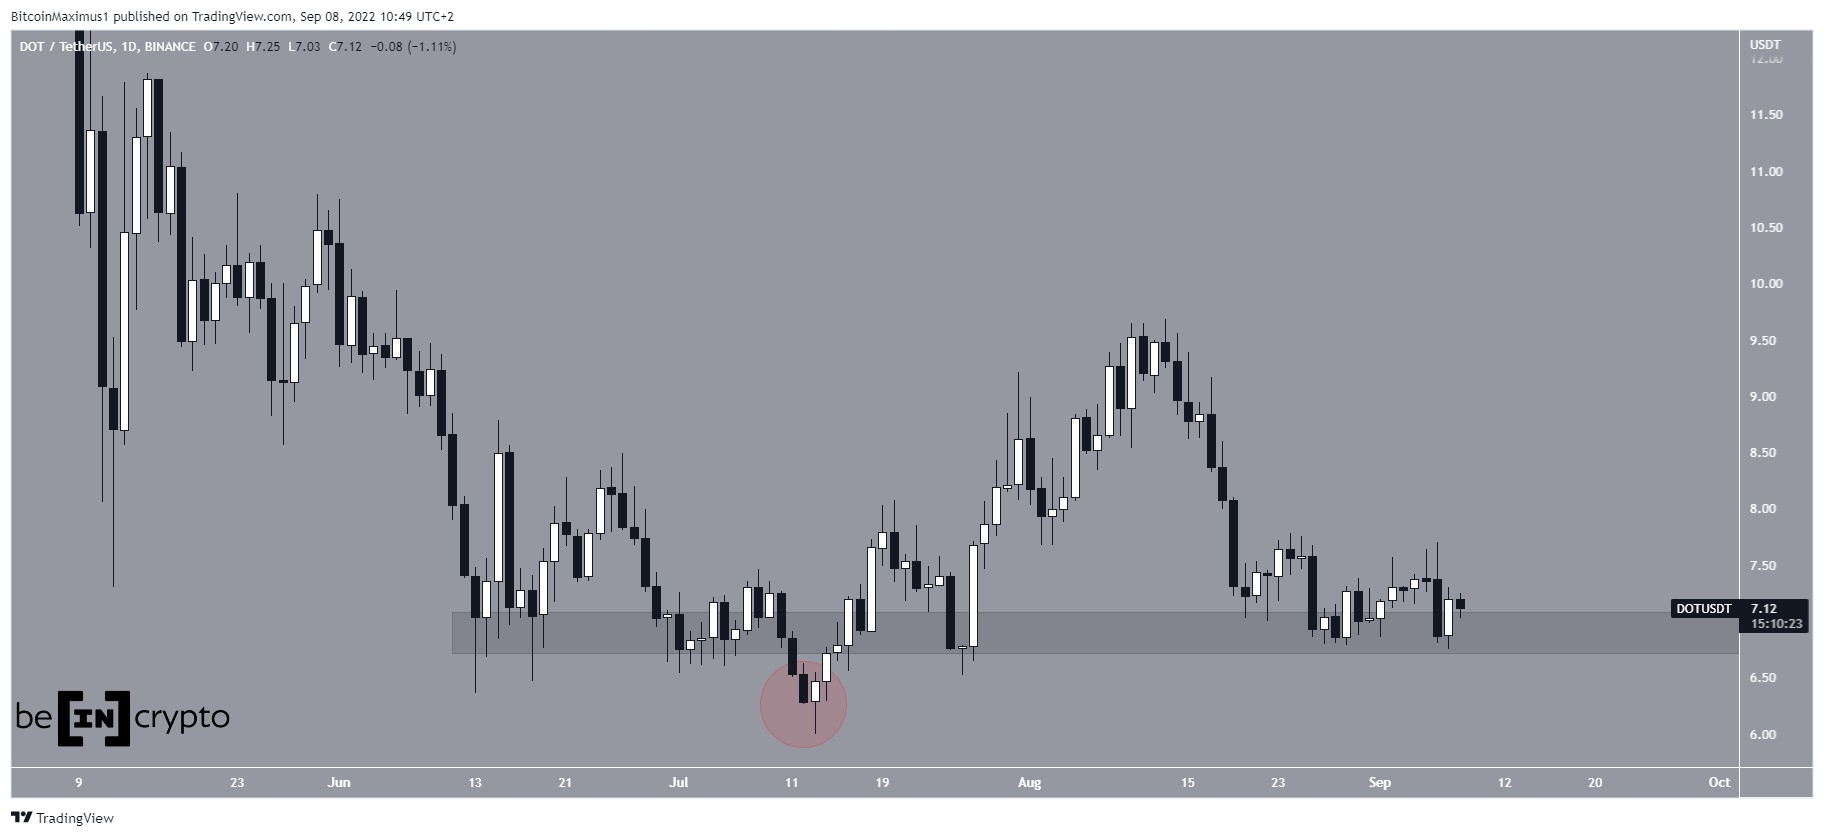
Both analysts agree on key resistance levels for Polkadot. The Cryptomist plans to add more if resistance is broken. Additionally, Planfomo identified resistance zones between $6.5-$7.0 and $8.5-$9.4. Overcoming these zones is crucial for Polkadot to change its market structure and regain momentum.
.rh-colortitlebox{margin-bottom:30px;background:#fff;line-height:24px;font-size:90%}.rh-colortitlebox .rh-colortitle-inbox{display:flex;align-content:center;padding:15px;font-weight:700;font-size:110%; line-height:25px}.rh-colortitlebox .rh-colortitle-inbox i{line-height:25px; margin:0 10px; font-size:23px}.rh-colortitlebox .rh-colortitle-inbox svg{width:25px;margin-right:10px}.rh-colortitlebox .rh-colortitle-inbox-label{flex-grow:1}.rh-colortitlebox .rh-colortitlebox-text{padding:20px}.rh-colortitlebox-text>*{margin-bottom:20px}.rh-colortitlebox-text>:last-child{margin-bottom:0} New Meme Coin to Watch Aiming to be Next $BONK, $WIF or $MEW.rh-toggler-open{height:auto !important} .rh-toggler-open .rh-tgl-show, .rh-toggler-open .rh-tgl-grad{display:none !important} .rh-toggler-open .rh-tgl-hide{display:block !important} .rh-tgl-show, .rh-tgl-hide{cursor:pointer} .rh-contenttoggler *{box-sizing: border-box !important} .rh-toggler-wrapper{overflow: hidden;transition: all 0.5s ease; padding-bottom: 35px; margin-bottom:30px;box-sizing: content-box !important;position: relative;} .rh-toggler-wrapper p:last-of-type {margin-bottom: 0;}Milei Moneda is a new meme coin inspired by the political and economic views of Javier Milei, an Argentine president known for his libertarian and pro-Bitcoin stance. You have an opportunity with the ongoing low presale price to get in early!
Sponsored
Show more +Show less – Polkadot Price AnalysisAn analysis Polkadot’s (DOT) price chart on TradingView showed signs of market indecision at the time writing. The daily chart reveals a small body with long wicks, indicating a balance between buyers and sellers.
However, the overall trend remains bearish, with the price below the 200-day Exponential Moving Average and the weekly Simple Moving Average sloping downward.
DOT daily price chart Source: TradingViewDOT’s indicators suggest a potential short-term upward movement despite the bearish trend. The RSI at 38.47 nears oversold territory, hinting at a possible bounce soon. The MACD’s bullish crossover could signal a buying opportunity. Support at 5.364 and resistance at 5.741 and 6.057 are crucial levels to watch.
The 200-day EMA at 7.047 emphasizes DOT’s ongoing downtrend. Bollinger Bands show DOT’s price near the lower band, indicating it might be oversold. Volume analysis reveals weakening selling pressure with a trading volume of 785.974K. This aligns with the possibility of a short-term reversal.
Moreover, Bollinger Bands further illustrate market sentiment with the upper band at 6.750, middle at 6.057, and lower at 5.364. DOT touching the lower band suggests a potential bounce. Besides, volume analysis supports this as it shows weakening selling pressure. These indicators collectively point to a possible upward movement soon.
Read also: Massive Bitcoin Mining Firm Reveals Its Mining Kaspa: KAS Price Surges
Key Levels to WatchSupport and resistance levels play a crucial role in DOT’s price action. The lower Bollinger Band around 5.364 serves as a critical support level for the token. Resistance is encountered near the weekly SMA at 5.741 and the middle Bollinger Band at 6.057.
Join Aethir’s exclusive airdrop and earn badges by participating in events or holding community tokens. Complete tasks and secure your spot before the snapshot date is revealed!
Check $RECQ Meme Coin Sponsored: Invest Responsibly, Do Your Own Research. Buy RECQ Today Serves as the base currency for all transactions within the Rebel Satoshi platformICO stage, offering tokens at a discounted price
Facilitates a smooth and efficient economy within the arcade, supporting both arcade and in-game transactions.
Grants access to a diverse range of gaming experiences in the Rebel Satoshi Arcade,
Contributes to a decentralized, community-driven RebelSatoshi platform that integrates gaming with elements of revolution, freedom, and unity, appealing to users who value such principles.
The post Polkadot Price Prediction: DOT Must Overcome This Resistance to Flip Bullish as Analysts Eye Decisive Breakout appeared first on CaptainAltcoin.
origin »Bitcoin price in Telegram @btc_price_every_hour
ETH/LINK Price Action Candlestick Set (LINKETHPA) на Currencies.ru
|
|
