2021-8-6 18:00 |
Today’s on-chain analysis provides a look at two long-term indicators that could signal a macro bottom in the BTC market. These are the Entity-Adjusted Number of Transactions on the Bitcoin network and the Entity-Adjusted Dormancy Flow.
Furthermore, the maximum and minimum bitcoin price models created by Willy Woo indicate that if today were the peak of a long-term bull market, BTC would cost $176,000. On the other hand, if we had a bear market, it would fall to $15,000.
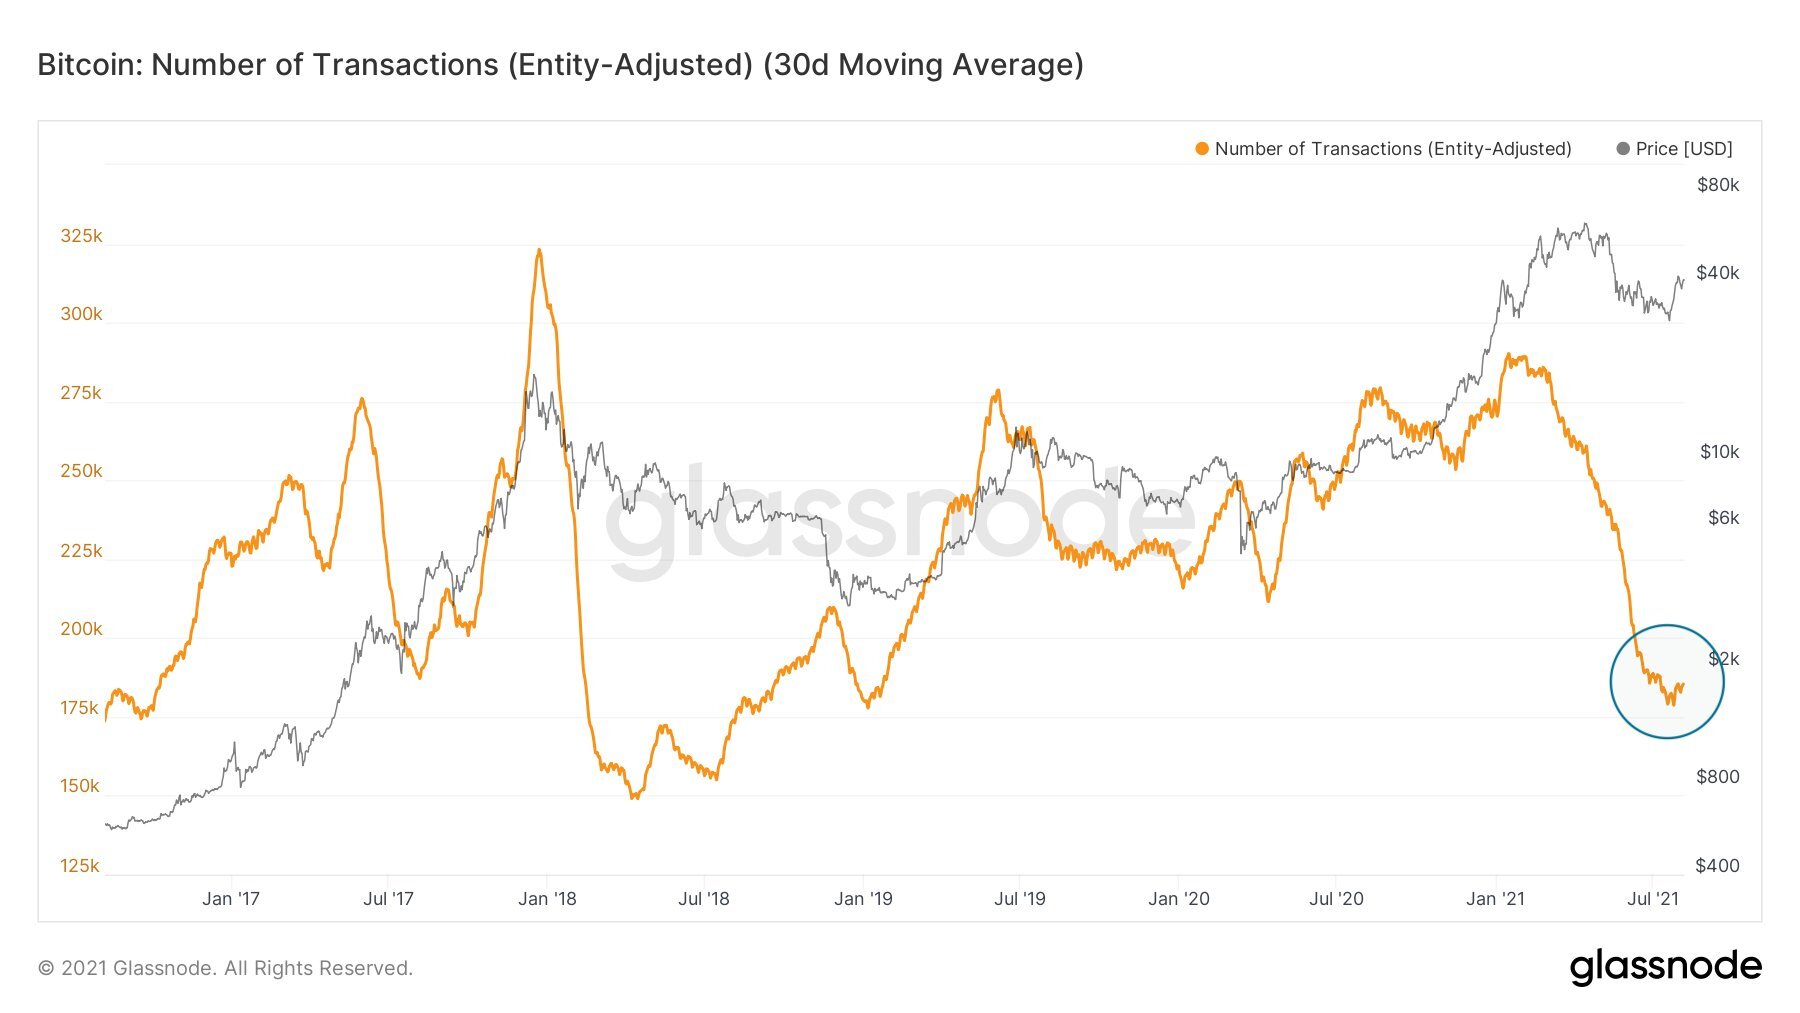
BTC number of transactions lowest in 2 yearsThe number of transactions on the Bitcoin network has reached a 2-year low. On-chain analyst Lex Moskovski tweeted today a chart of the 30-day moving average Entity-Adjusted Number of Transactions. It shows that the value has fallen to a level in the area of 180,000, which has not been recorded since January 2019.
Source: Twitter
This was a period in which the bitcoin price was at the end of a long-term downtrend, around $3,000. According to Moskovski’s opinion, this reading gives the potential for a resumption of increases on BTC:
“If hodlers, whales, and traders manage to push the price higher attracting the normie retail, this chart will change pretty fast.”
Purge of noobsThe narrative of an ongoing bottom on bitcoin’s price and a potential bounce is supported by another on-chain analysis chart, the so-called Entity-Adjusted Dormancy Flow. This chart was highlighted today by another on-chain analyst Will Clemente.
The indicator expresses the ratio of current market capitalization and the annualized dormancy value. It can be used to identify macro market bottoms and estimate when the market is in relatively normal conditions. Moreover, its reset to the green range of around 200,000 is associated with a complete purge of newcomer market positions.
The chart shows that the Dormancy Flow indicator is near the long-term trendline (red). It has marked the bottoms on BTC with great accuracy almost since its beginning.
Entity-Adjusted Dormancy Flow / Source: Glassnode
So far, the line has recorded 4 touches (blue circles): in 2011, 2015, 2019, and 2020, all of which occurred at macro lows in the BTC market, recording prices to which bitcoin has never returned.
Admittedly, the Dormancy Flow indicator has not touched that line in the current market situation, but it came close enough to it on July, 20. Clemente says that this full reset on Dormancy Flow means that “the noobs have been almost fully purged.”
Peak at $176,000The aforementioned analyst tweeted yet another chart of bitcoin’s long-term price action, onto which he has overlaid several curves based on Willy Woo’s models.
It allows us to visualize the relative value of BTC in relation to historical peaks and lows in the market.
On the chart, in addition to the BTC price, we observe the line of the top price (purple), the minimum price (Delta Price, pink), and the mean between these two values (Formula 3, dark blue). Currently, the BTC price, which is fighting the resistance area at $40,500, is between the minimum price and the mean.
Source: Twitter
Clemente points out that, at this point, the maximum price is at $176,000 and the minimum at $15,000. In addition, the mid-price line has provided a good approximation of Bitcoin’s April all-time high of $64,800.
For BeInCrypto’s latest bitcoin (BTC) analysis, click here.
The post On-Chain Analysis: Two Indicators Signal a Long-Term Bottom for Bitcoin appeared first on BeInCrypto.
origin »Bitcoin (BTC) на Currencies.ru
|
|