2021-6-10 17:15 |
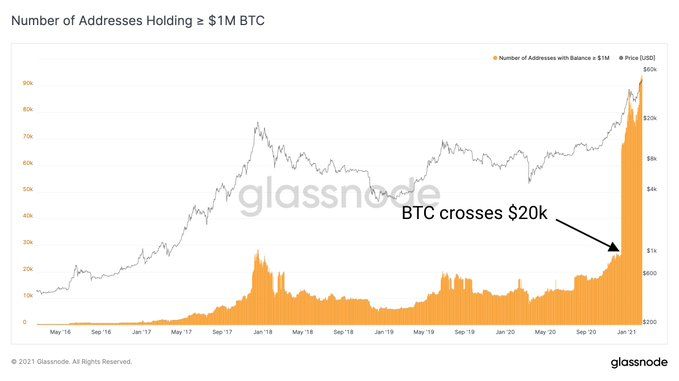
A look at on-chain indicators for Bitcoin (BTC), more specifically the number of new/active addresses and the number of transactions.
So far, both the decrease in the number of new addresses and the decrease in transactions is more similar to that of May 2017 than it is to the beginning of the bear market in Dec. of the same year.
Number of new addresses for BTCThe number of new addresses reached an all-time high of 664,993 on Dec. 15, 2017, coinciding with the then all-time high price of nearly $19,764. What followed afterwards was a sharp decrease in the number of new addresses, leading to a low of 234,169 on April 2019. In total, this amounted to a decrease of 65%.
Unlike the 2017 period, the number of new addresses did not reach a peak at the same time as the price in 2021. It peaked on Jan. 8, 2021, with a high 617,317 addresses. Interestingly, the BTC price at the time was at $40,770 and did not reach a new all-time high for several months afterwards.
Afterwards, the number of new addresses gradually decreased until April before falling sharply during the May correction. It reached a low of 362,402 on May 30. Unlike the 2017 drop, this amounted to a smaller decrease of 41%
The decrease is more comparable to that of May-Aug. 2017, when the number of new addresses fell by 35% and that of Feb. – March 2016, when it fell by 30%. Both times, the price continued moving higher shortly afterwards.
However, it remains to be seen if this is the end of the decrease for the number of new addresses or if they will fall further, resembling the 2017 decrease.
Chart By GlassnodeIn addition to the number of BTC active addresses also managed to reach a new yearly low of 715,945 on June 6, showing that participants are losing interest in the market.
Source: Twitter Transaction countThe transaction count provides a very similar picture to that of number of addresses.
An all-time high number of 413,633 transactions was reached on Dec. 2017. A sharp drop of 61% followed, leading to a low of 162,814 on March 2018. The rate of decrease of 61% was very similar to that of 65% that occurred in the number of new addresses.
The 2021 movement also saw a high reached on Jan. 2021 instead of in April, when the BTC all-time high price was reached. In addition, the ensuing decrease amounted to only 41%. The rate of decrease of 41% is identical to that on May – July 2017.
Therefore, similar to the number of new addresses, the decrease in transactions is more akin to that of May 2017 than the beginning of the bear market in Dec. 2017. However, this is conditional on the number of addresses/transactions not continuing to drop further.
Chart By GlassnodeFor BeInCrypto’s latest bitcoin (BTC) analysis, click here.
The post On-Chain Analysis: Analyzing the Decrease in BTC Addresses appeared first on BeInCrypto.
origin »Bitcoin (BTC) на Currencies.ru
|
|


