2022-6-15 23:30 |
Oasis Network (ROSE) has swept the lows of a long-term horizontal support area but has yet to break down below it.
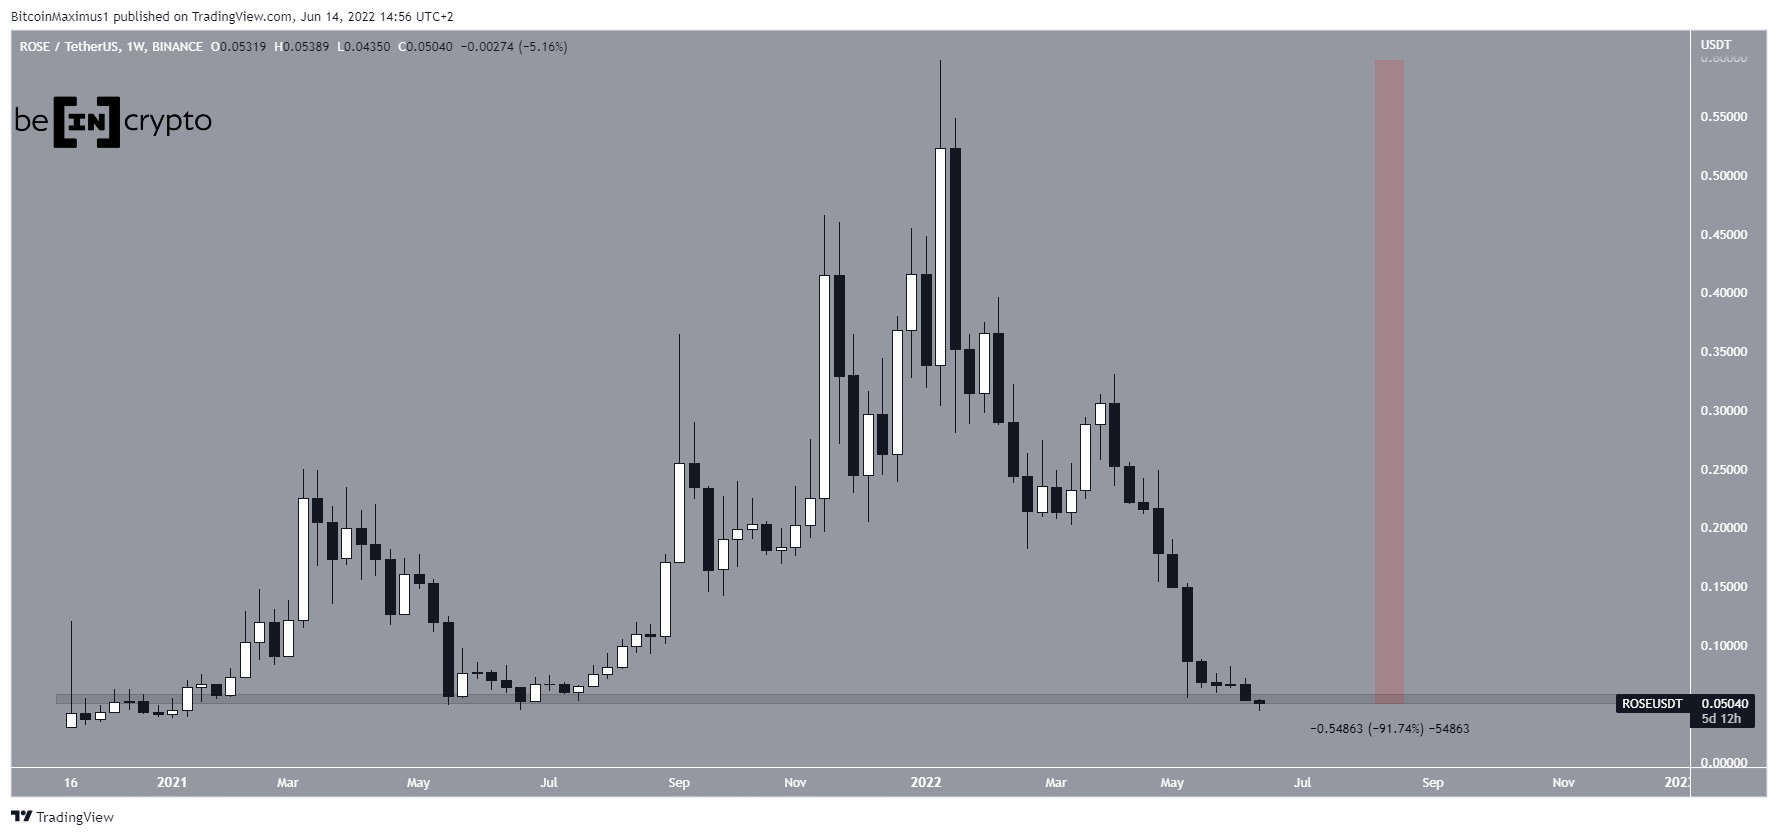
ROSE has been falling since reaching an all-time high price of $0.598 on Jan. 10, 2022. The downward movement led to a low of $0.043 on June 13. Measuring from the all-time high, this amounted to a drop of 91.75%.
The ensuing bounce served to validate the $0.055 horizontal area as support. The price has not traded below this level since early 2021. So, a breakdown below this area would likely take it towards a new all-time low.
ROSE/USDT Chart By TradingViewCryptocurrency trader @elontrades tweeted a chart of ROSE, stating that he has added to his holding at $0.05. The support area coincides with that outlined above.
Source: Twitter Bullish divergencesThe daily chart shows that ROSE has been falling underneath a descending resistance line since April 5, and has just reached the line for the third time.
While the fact that the price has not yet broken out is bearish, the RSI readings are extremely bullish. The daily RSI has generated bullish divergence (green line) and has previously broken out from a descending trendline (black). So, it is possible that the price will soon follow suit.
If it does, the next closest resistance area would be at $0.15, created by the 0.382 Fib retracement resistance level.
ROSE/USDT Chart By TradingView ROSE/BTCSimilar to the ROSE/USD pair, the ROSE/BTC pair is following a descending resistance line. However, the latter can be considered bullish since it has already broken out from a shorter-term descending resistance line (dashed).
Additionally, besides the bullish divergence, the RSI has completed a failure swing bottom, since the indicator has moved above the high between the divergences (red icon).
As a result, a breakout from the line could soon occur.
ROSE/BTC Chart By TradingViewFor Be[in]Crypto’s latest bitcoin (BTC) analysis, click here
The post Oasis Network (ROSE) Sweeps June 2021 Lows appeared first on BeInCrypto.
origin »Bitcoin price in Telegram @btc_price_every_hour
Oasis City (OSC) на Currencies.ru
|
|


