Visualizations - Свежие новости | |
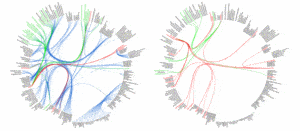
Flare | Data Visualization for the Web
Flare makes it easy to create interactive data visualizations To begin making your own visualizations, download flare and work through the tutorial below. Need more help? Visit the help forum (you’ll need a SourceForge login to post). дальше »
2020-6-9 16:32 | |
|
|
A Picture’s Worth a Thousand Words: 18 of the Coolest Visualizations for Exploring the Bitcoin Network
Analyzing and exploring the Bitcoin blockchain is always interesting, but for the more abstract thinker, several sites provide unique looks at the network, nodes, and transaction data in easy to grok, visual fashion. дальше »
2020-3-1 13:32 | |
|
|
Microsoft launches its Clarity web analytics tool for A/B testing and visualizing user sessions
To help webmasters understand how visitors interact with their sites, Microsoft has launched its new Clarity analytics tool in beta today. Set to rival the likes of Optimizely, Google Optimize and Visual Web Optimizer, Clarity lets you run A/B tests, and play back visualizations of users’ experiences and behavior patterns on your site. дальше »
2018-12-13 09:26 | |
|
|


