Chart - Свежие новости [ Фото в новостях ] | |

Bitcoin Volatility Rate Is Slowly Decreasing, Making a Stronger Case for BTC as ‘Real’ Money
Bitcoin has a bad reputation to be highly volatile and incredibly unpredictable. As a matter of fact, it does not respond to any of the things that usually move traditional currencies, stocks, and shares, or commodities. дальше »
2019-6-14 19:47 | |
|
|

Bitcoin Price Analysis: Short Squeeze Pushing Up BTC Price to $8.5K
Bitcoin buyers are attempting to reject the bearish rising wedge pattern right now, after a short squeeze on the Bitcoin futures market elevated the price beyond $8,300. Will bulls be able to maintain this momentum, or will the heavy selling pressure prove too much to handle? Let’s take a look. дальше »
2019-6-14 17:00 | |
|
|
Bitcoin (BTC) Price Gaining Momentum: Break Above $8,500 Likely
Bitcoin price extended gains recently and broke the $8,100 and $8,200 resistances against the US Dollar. The price seems to be setting up for more gains above the $8,300 resistance area. There is a crucial bullish trend line forming with support near $8,140 on the hourly chart of the BTC/USD pair (data feed from Kraken). дальше »
2019-6-14 09:00 | |
|
|
Ethereum (ETH) Price Testing Key Support: $250 Holds The Key
ETH price started a downside correction after trading towards the $265 level against the US Dollar. The price declined below the $255 level, but the $250 support area is acting as a support. There is a key bullish trend line forming with support near $253 on the hourly chart of ETH/USD (data feed via Kraken). дальше »
2019-6-14 06:08 | |
|
|
Google Trends Shows Bitcoin Is About to Explode in South Korea
South Korea has long been a key region for Bitcoin adoption. Now its government and banks are coming around, Googe Trends reveals an interesting pattern. Every day for the last week, South Koreans have been waking up with Bitcoin on their minds. дальше »
2019-6-14 01:00 | |
|
|
MoonTrader ICO
MoonTrader team has developed and is supporting the trading terminal (MoonBot - moon-bot. com) which was introduced in October 3, 2017. Currently, the performance of MoonBot surpasses that of most existing trading systems as a result of its advanced functionality and the high security features designed to protect your trading activities. дальше »
2019-6-13 21:03 | |
|
|
This Bitcoin Chart Destroys the Argument That BTC Can’t Be Money
By CCN Markets: Every skeptic says the same thing: the bitcoin price is too volatile to be a real currency. And they’ve got a point. Bitcoin’s huge swings make it risky as an investment and difficult as a day-to-day payment method. дальше »
2019-6-14 19:35 | |
|
|
Bitcoin Price: Bulls Under Pressure to Break $8.2K in Rising Wedge
Bitcoin buyers appear to be eyeing the psychological $8,200 level above today, but fears of a rising wedge reversal could put an abrupt end to the rising price. Let’s take a closer look. Bitcoin 4-Hour Chart On the 4-Hour BTC/USD chart, the price appears to be consolidating inside a bearish rising wedge pattern between two pinching trendlines. дальше »
2019-6-13 19:15 | |
|
|
Google Trends Bitcoin Searches, a Key Price Indicator, Turn Mega Bullish
By CCN Markets: On June 7, Coin Street News (@CoinStreetNews) shared a chart on Twitter that could have serious implications on bitcoin’s price action. The account specializes in technical analysis of cryptocurrencies and other assets. дальше »
2019-6-14 18:40 | |
|
|
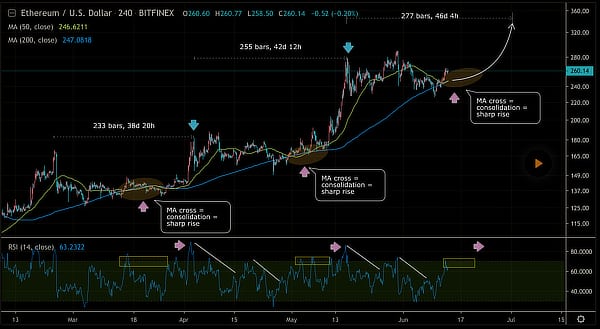
Bitcoin Price Eyes Chart Pattern That Kicked Off Bull Market in 2015
Bitcoin is about to see a key bullish cross of two moving averages the first time in nearly four years. дальше »
2019-6-13 14:00 | |
|
|

Are Bitcoin Futures predicting the future for Bitcoin’s spot prices?
Bitcoin’s price action is similar to a lot of other bubbles in history. In fact, BTC’s chart and patterns have striking similarities to the DotCom bubble, Qualcomm Charts etc. , which could be due to the fractal nature that is witnessed everywhere in nature and in human behavior. дальше »
2019-6-13 11:30 | |
|
|
Bitcoin (BTC) Price Smashes Resistance: Primed For More Gains
Bitcoin price broke to the upside and cleared the $7,950 and $8,000 barriers against the US Dollar. The price even broke the $8,200 resistance area and it is currently correcting lower. There is another major breakout pattern forming with resistance near $8,200 on the hourly chart of the BTC/USD pair (data feed from Kraken). дальше »
2019-6-13 09:00 | |
|
|
Ethereum (ETH) Price Rallies Above $260: Turned Buy On Dips
ETH price started a strong upward move after it broke the key $250 resistance against the US Dollar. The price even broke the $255 and $260 resistance levels to move into a positive zone. There is a major bullish trend line forming with support near $252 on the hourly chart of ETH/USD (data feed via. дальше »
2019-6-13 07:08 | |
|
|
Tesla’s Stock Could Follow in Footsteps of a High-Flying Tech Play: Analyst
By CCN Markets: On CNBC, analyst Eddie Yoon of a think tank called “EddieWouldGrow” overlaid a chart of Netflix from 2011-13 onto Tesla’s chart since January. Gosh, those charts look so similar. Maybe Tesla’s stock will do the same thing as Netflix’s stock and make a huge comeback. дальше »
2019-6-13 01:15 | |
|
|
Stellar (XLM), Bitcoin (BTC), and EOS Price Analysis and Forecast
Bitcoin (BTC-USD) On an hourly chart, BTC/USD pair is trending on a sideways trend contained by a horizontal price channel as indicated by the intertwining Moving Averages. During the last 24hrs, BTC/USD pair exhibited a bullish outlook. дальше »
2019-6-13 21:01 | |
|
|
Bitcoin (BTC) Halving In An Electioneering Year, Is LTC Pacesetting?
Bitcoin (BTC) adds 6. 1 percent Ahead of next year’s halving, BTC is likely to inch higher Tone Vays, a Bitcoin supporter and a former Financial Analyst at JP Morgan, is edgy of the current uptrend. дальше »
2019-6-12 21:00 | |
|
|
Bitcoin (BTC) Price Approaching Next Break: Bullish or Bearish?
Bitcoin price recovered recently above $7,900 and $8,000 against the US Dollar. The price failed to stay above $8,000, formed a swing high at $8,080, and recently declined below $7,900. There is a key breakout pattern forming with resistance near $7,940 on the hourly chart of the BTC/USD pair (data feed from Kraken). дальше »
2019-6-12 07:00 | |
|
|
Ripple (XRP) Price Face Resistance: Can Bulls Overcome 100 SMA?
Ripple price started a short term recovery from the $0. 3686 swing low against the US dollar. The price traded above the $0. 4000 level, but it failed to surpass the $0. 4050 resistance. There is a key contracting triangle forming with resistance near $0. дальше »
2019-6-12 06:00 | |
|
|
Bitcoin Price: Does New Tether Market Cap ATH Suggest BTC is Next?
It’s common knowledge in the crypto market that the circulating supply of Tether (USDT) has a direct impact on Bitcoin price. So with Tether’s market cap spiking to a new YTD-high right now, should we expect BTC to follow closely behind? Let’s take a look. дальше »
2019-6-11 20:00 | |
|
|
Bitcoin Resistance Turns Support at $8,000 as H&S Pattern Forming
Following the close of a big red candle on the weekly chart, many expected the pullback to accelerate and Bitcoin price to fall even further today. Such is the nature of crypto markets that BTC did the opposite and moved back up above $8,000 once again. дальше »
2019-6-11 08:30 | |
|
|
Bitcoin (BTC) Price Recovers Sharply: Is This A Real Bullish Move?
Bitcoin price started a fresh upward move after trading as low as $7,519 against the US Dollar. The price gained pace above the $7,700 resistance and even traded above $7,800. Yesterday’s highlighted key bearish trend line was breached with resistance near $7,780 on the hourly chart of the BTC/USD pair (data feed from Kraken). дальше »
2019-6-11 07:00 | |
|
|
Ethereum (ETH) Price Grinding Higher: $255 Presents Crucial Challenge
ETH price started a steady rebound above the $240 and $245 resistance levels against the US Dollar. The price traded close to the $250 resistance area and it is currently consolidating in a range. дальше »
2019-6-11 06:00 | |
|
|
Analysis – XRP Bulls Look Set To Push The Price Above $0.4
Supply zones: $0. 42, $0. 46, $0. 49 Demand zones: $0. 39, $0. 35, $0. 32 XRP/USD Long-term Trend: Bearish On the 24-Hour chart, XRP/USD was bearish. The Bears were in control of the XRP market. The price action has formed a descending channel on the 4-Hour chart. дальше »
2019-6-11 22:14 | |
|
|
Bitcoin Giving off a Bearish Indication as it Mirrors the Surge from $3,200
Bitcoin is back to being green as the leading cryptocurrency trades at $7,984 with 24 hours gains of 1.50 percent. The new week has started on a good note as today we went from $7,523 to $8,090. As can be seen in the Bitcoin USD price chart, in a matter of 15 minutes, Bitcoin added […] дальше »
2019-6-10 20:18 | |
|
|
Аналитики прогнозируют снижение цены биткоина в краткосрочной перспективе
По мнению ряда теханалитиков, цена биткоина, вероятнее всего, в ближайшее время скорректируется вниз. Однако спустя некоторое время рост продолжится. Так, согласно наблюдениям CryptoFibonacci «цифровое золото» в настоящее время торгуется заметно ниже диапазона $8600-8800, достигнутого на прошлой неделе. дальше »
2019-6-11 19:50 | |
|
|
This Cryptocurrency Price Chart is Making Pre Parabolic Set Ups
Bitcoin is famous for its parabolic rise that drives the speculators’ interest in the world’s top cryptocurrency. This parabolic curve was what drove BTC to $20,000 during the last bull run and can further take it to as high as $1 million in the future. дальше »
2019-6-10 19:14 | |
|
|

Аналитики: в краткосрочной перспективе биткоин ждет коррекция
По мнению ряда теханалитиков, цена биткоина, вероятнее всего, в ближайшее время скорректируется вниз. Однако спустя некоторое время рост продолжится. Так, согласно наблюдениям CryptoFibonacci «цифровое золото» в настоящее время торгуется заметно ниже диапазона $8600-8800, достигнутого на прошлой неделе. дальше »
2019-6-10 18:32 | |
|
|
Bitcoin Price: Did The ‘CME Gap’ Strike Again to Retest $8,000?
Bitcoin price closed the week at $7632, down 12. 6%, marking the worst week for the top Crypto asset in 2019. Let’s take a look at whether this is likely to be a blip in the road, or marks the start of a bigger correction for Bitcoin. дальше »
2019-6-10 17:20 | |
|
|
Ethereum’s [ETH] chart displays formation of possible Head and Shoulder pattern; is a correction wave imminent?
Ethereum, the second largest cryptocurrency in the world and the largest altcoin in terms of market cap, followed Bitcoin’s suit and displayed bullish exhaustion and a possible reversal in trend. дальше »
2019-6-10 11:30 | |
|
|

Bitcoin, Ether, and XRP Weekly Market Update: June 10, 2019
The total crypto market cap is $31. 2 billion down for the seven-day period and now stands at $245. 4 billion. The top ten cryptocurrencies are all in red for the same time frame with Litecoin (LTC) being the only exception. дальше »
2019-6-10 11:00 | |
|
|
Bitcoin (BTC) Price Turns Bearish: Bulls Could Face Resistance Near $7,800
Bitcoin price remained in a bearish zone and recently declined below $7,600 against the US Dollar. The price retested the $7,500 support area and it is currently consolidating losses. There is a key bearish trend line forming with resistance near $7,820 on the hourly chart of the BTC/USD pair (data feed from Kraken). дальше »
2019-6-10 08:00 | |
|
|
Ripple (XRP) Price Analysis: Recovery Likely To Remain Capped
Ripple price extended its decline below the $0. 4000 support area against the US dollar. The price even broke the $0. 3800 support area and traded close to the $0. 3660 level. There is a major bearish trend line forming with resistance near $0. дальше »
2019-6-10 07:08 | |
|
|

Analyst: Bitcoin Losing Steam, Could Fall Just as BTC Rallied Off $3,200 Bottom
Current Bitcoin Chart Looks Like The $3,200 Bottom Inversed After days of inaction, Bitcoin (BTC) bears have finally shown their hand. In the past 24 hours, the leading cryptocurrency has shed around 2%, falling from a multi-day. дальше »
2019-6-10 00:28 | |
|
|
Bitcoin to face an imminent drop by $400; Bull momentum vanishes as weekly chart bleeds red
Bitcoin’s meteoric surge had everyone believe that it was the start of the bull rally; however, that rally seems to have exhausted the bulls as the price is stuck in a sideways movement. Short-Term Analysis The price of Bitcoin is stuck in a sideways movement without any massive dips or surges for over five days, […] The post Bitcoin to face an imminent drop by $400; Bull momentum vanishes as weekly chart bleeds red appeared first on AMBCrypto. дальше »
2019-6-10 18:00 | |
|
|
Ethereum (ETH) Price Weekly Forecast: More Downsides Likely
ETH price failed to gain momentum above $250 and $252 against the US Dollar. The price is currently well below $250 and it remains at a risk of more losses. There is a major bearish trend line forming with resistance at $248 on the 4-hours chart of ETH/USD (data feed via Kraken). дальше »
2019-6-9 08:00 | |
|
|
Crypto Top 3 Price Analysis – Is Bitcoin Heading Lower?
The Crypto Total Market Cap chart is a good indicator to gauge where the market could be heading. By that of course, we still know wherever Bitcoin moves, the rest follow. But key regions can still be identified to see how the overall market is performing. дальше »
2019-6-9 22:33 | |
|
|
Bitcoin Trading Secrets: How to Wheel & Deal Like a Crypto Whale
By CCN: The crypto newswire went berserk after a research firm published a blockbuster report revealing deep-pocketed “whales” had jumped into the BTC market at the end of 2018 to take advantage of the bitcoin price dump. дальше »
2019-6-8 16:00 | |
|
|
Crypto Chart Analyst Peter Brandt: You Should Buy Ripple’s XRP and Litecoin (LTC)
Many people follow cryptocurrency gurus in order to discover the best investments. They all have their hot takes and sometimes they are actually spot on in what is going to happen in the markets. Peter Brandt is often considered a very prominent crypto guru and he spoke on social media this week predicting the future […] дальше »
2019-6-8 00:56 | |
|
|

Bitcoin (BTC) Chart Still Shows ‘Overbought’ Signs, Should Investors Be Worried?
Bitcoin Isn’t in The Clear Yet Over the past week, Bitcoin (BTC) bulls have finally begun to relent. Earlier this week, BTC hit $7,450 just days after hitting $9,100 — a drop of around 20%. дальше »
2019-6-7 23:00 | |
|
|
XRP v. Stellar Lumens [XLM] Price Analysis: XRP awaits bull rally as XLM holds firm
XRP was in the news recently after 23 million XRP were reportedly stolen during a security breach on GateHub. Its competitor, Stellar Lumens [XLM] remained firm on the 10th position on cryptocurrency charts. дальше »
2019-6-7 17:30 | |
|
|
Bitcoin (BTC) Price Forming Double Bottom: Setting Stage For Rebound
Bitcoin price seems to be forming a strong support base near $7,440 against the US Dollar. The price recovered above $7,700 and it is currently trading near the $7,800 resistance area. There is a major bearish trend line forming with resistance near $7,950 on the hourly chart of the BTC/USD pair (data feed from Kraken). дальше »
2019-6-7 09:00 | |
|
|
Ripple (XRP) Price Showing Bullish Signs: Look For Break Above $0.44
Ripple price started a decent recovery from the $0. 3840 support area against the US dollar. The price traded above the $0. 4000 resistance and it is currently showing positive signs. There was a break above a connecting bearish trend line with resistance at $0. дальше »
2019-6-7 08:00 | |
|
|
This Macro Chart Shows Bitcoin Has Never Seen a Bear Market
With bitcoin price never experiencing a lower yearly low, is it correct to say the top-ranked crypto has ever been in a bear market? Has Always Been a Bull Market for Bitcoin It is common to come across mention of narratives like “the 2018 bitcoin bear market. дальше »
2019-6-6 22:00 | |
|
|
Bitcoin Price Analysis: $7,700 Support Under Threat in Falling Wedge
Bitcoin bears have upped their assault in the last hour, driving BTC price down $200 on to the $7,700 support below. Can bulls defend against the mounting selling pressure, or will the asset continue unraveling inside the falling wedge pattern? Let’s take a look. дальше »
2019-6-6 20:00 | |
|
|
Double Bearish Divergence Leads to Price Declines For Bitcoin Cash [Price Analysis]
Bitcoin Cash Price Analysis: Bitcoin Cash / USD Significant declines took place across the cryptocurrency market on Monday and Tuesday this week. A double bearish divergence formed on the Bitcoin Cash daily USD chart prior to these declines. дальше »
2019-6-6 13:29 | |
|
|