Chart - Свежие новости [ Фото в новостях ] | |

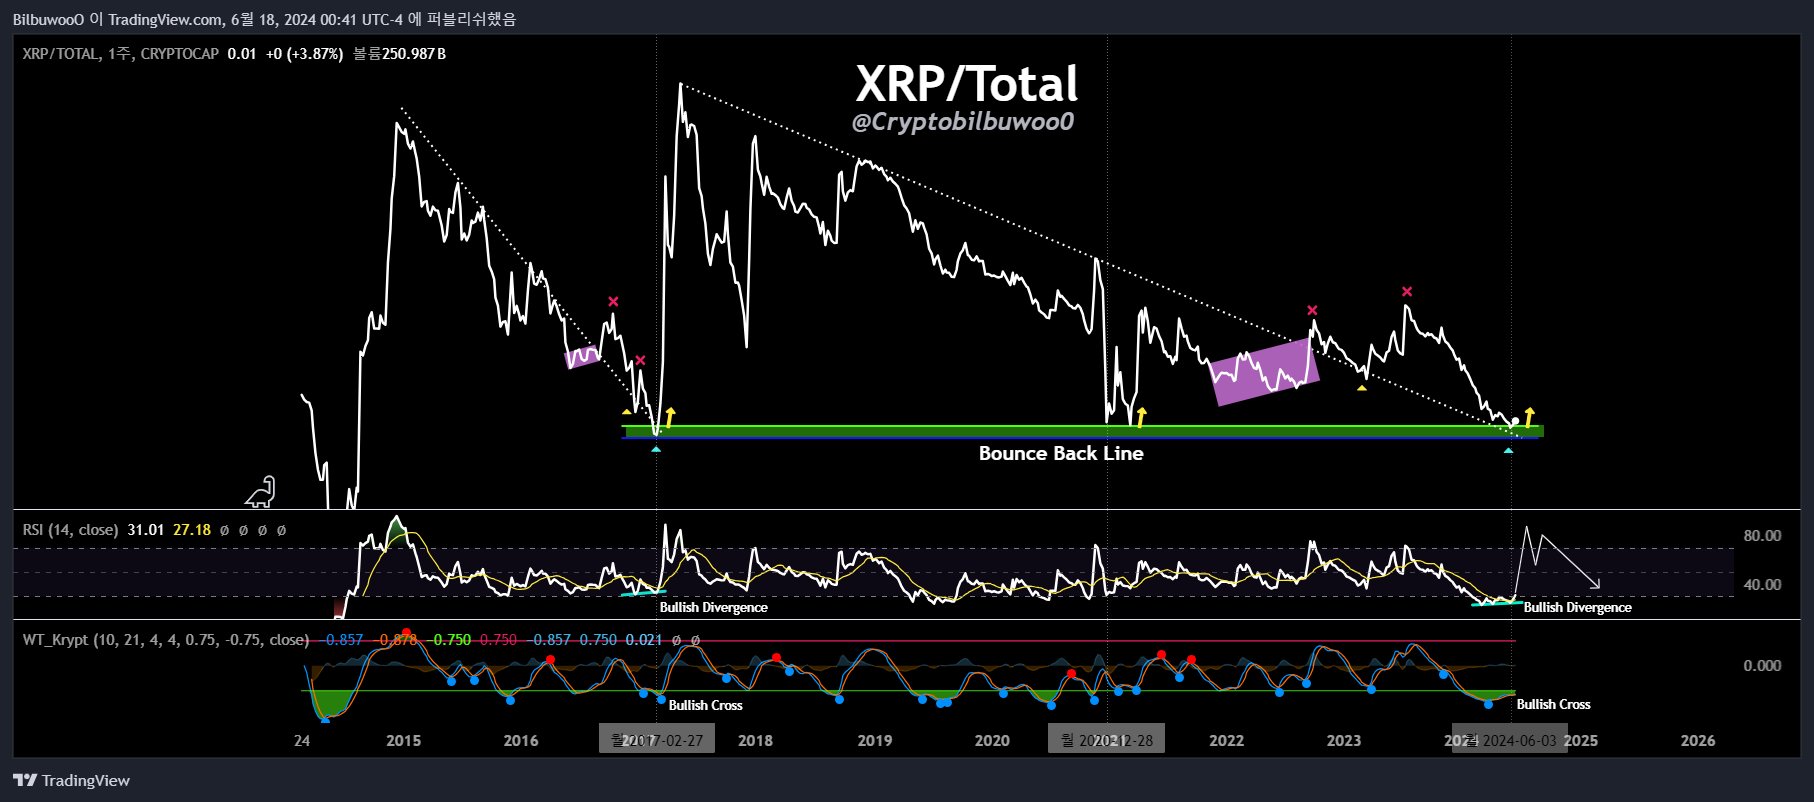
XRP Set For Monumental Rally: Analyst Points To Extremely Rare Signal
The latest chart analysis by crypto analyst @Cryptobilbuwoo0, published via X, offers a compelling narrative for XRP’s potential upward trajectory when juxtaposed against the total cryptocurrency market capitalization. дальше »
2024-6-18 12:00 | |
|
|
SushiSwap (SUSHI) Faces Bearish Trends Amid Technical and Fundamental Weakness
SUSHI is showing clear bearish trends on the daily chart, struggling to break key resistance levels. The post SushiSwap (SUSHI) Faces Bearish Trends Amid Technical and Fundamental Weakness appeared first on BeInCrypto. дальше »
2024-6-14 22:00 | |
|
|

Solana Set For “A Major 53% Price Move,” Analyst Reveals Why
An analyst has explained how Solana could be setting up for a major 53% move based on a Symmetrical Triangle pattern forming in its price chart. Solana Has Been Travelling Inside A Symmetrical Triangle Recently In a new post on X, analyst Ali Martinez discussed a pattern that has recently taken shape in Solana’s daily price chart. дальше »
2024-6-14 20:00 | |
|
|
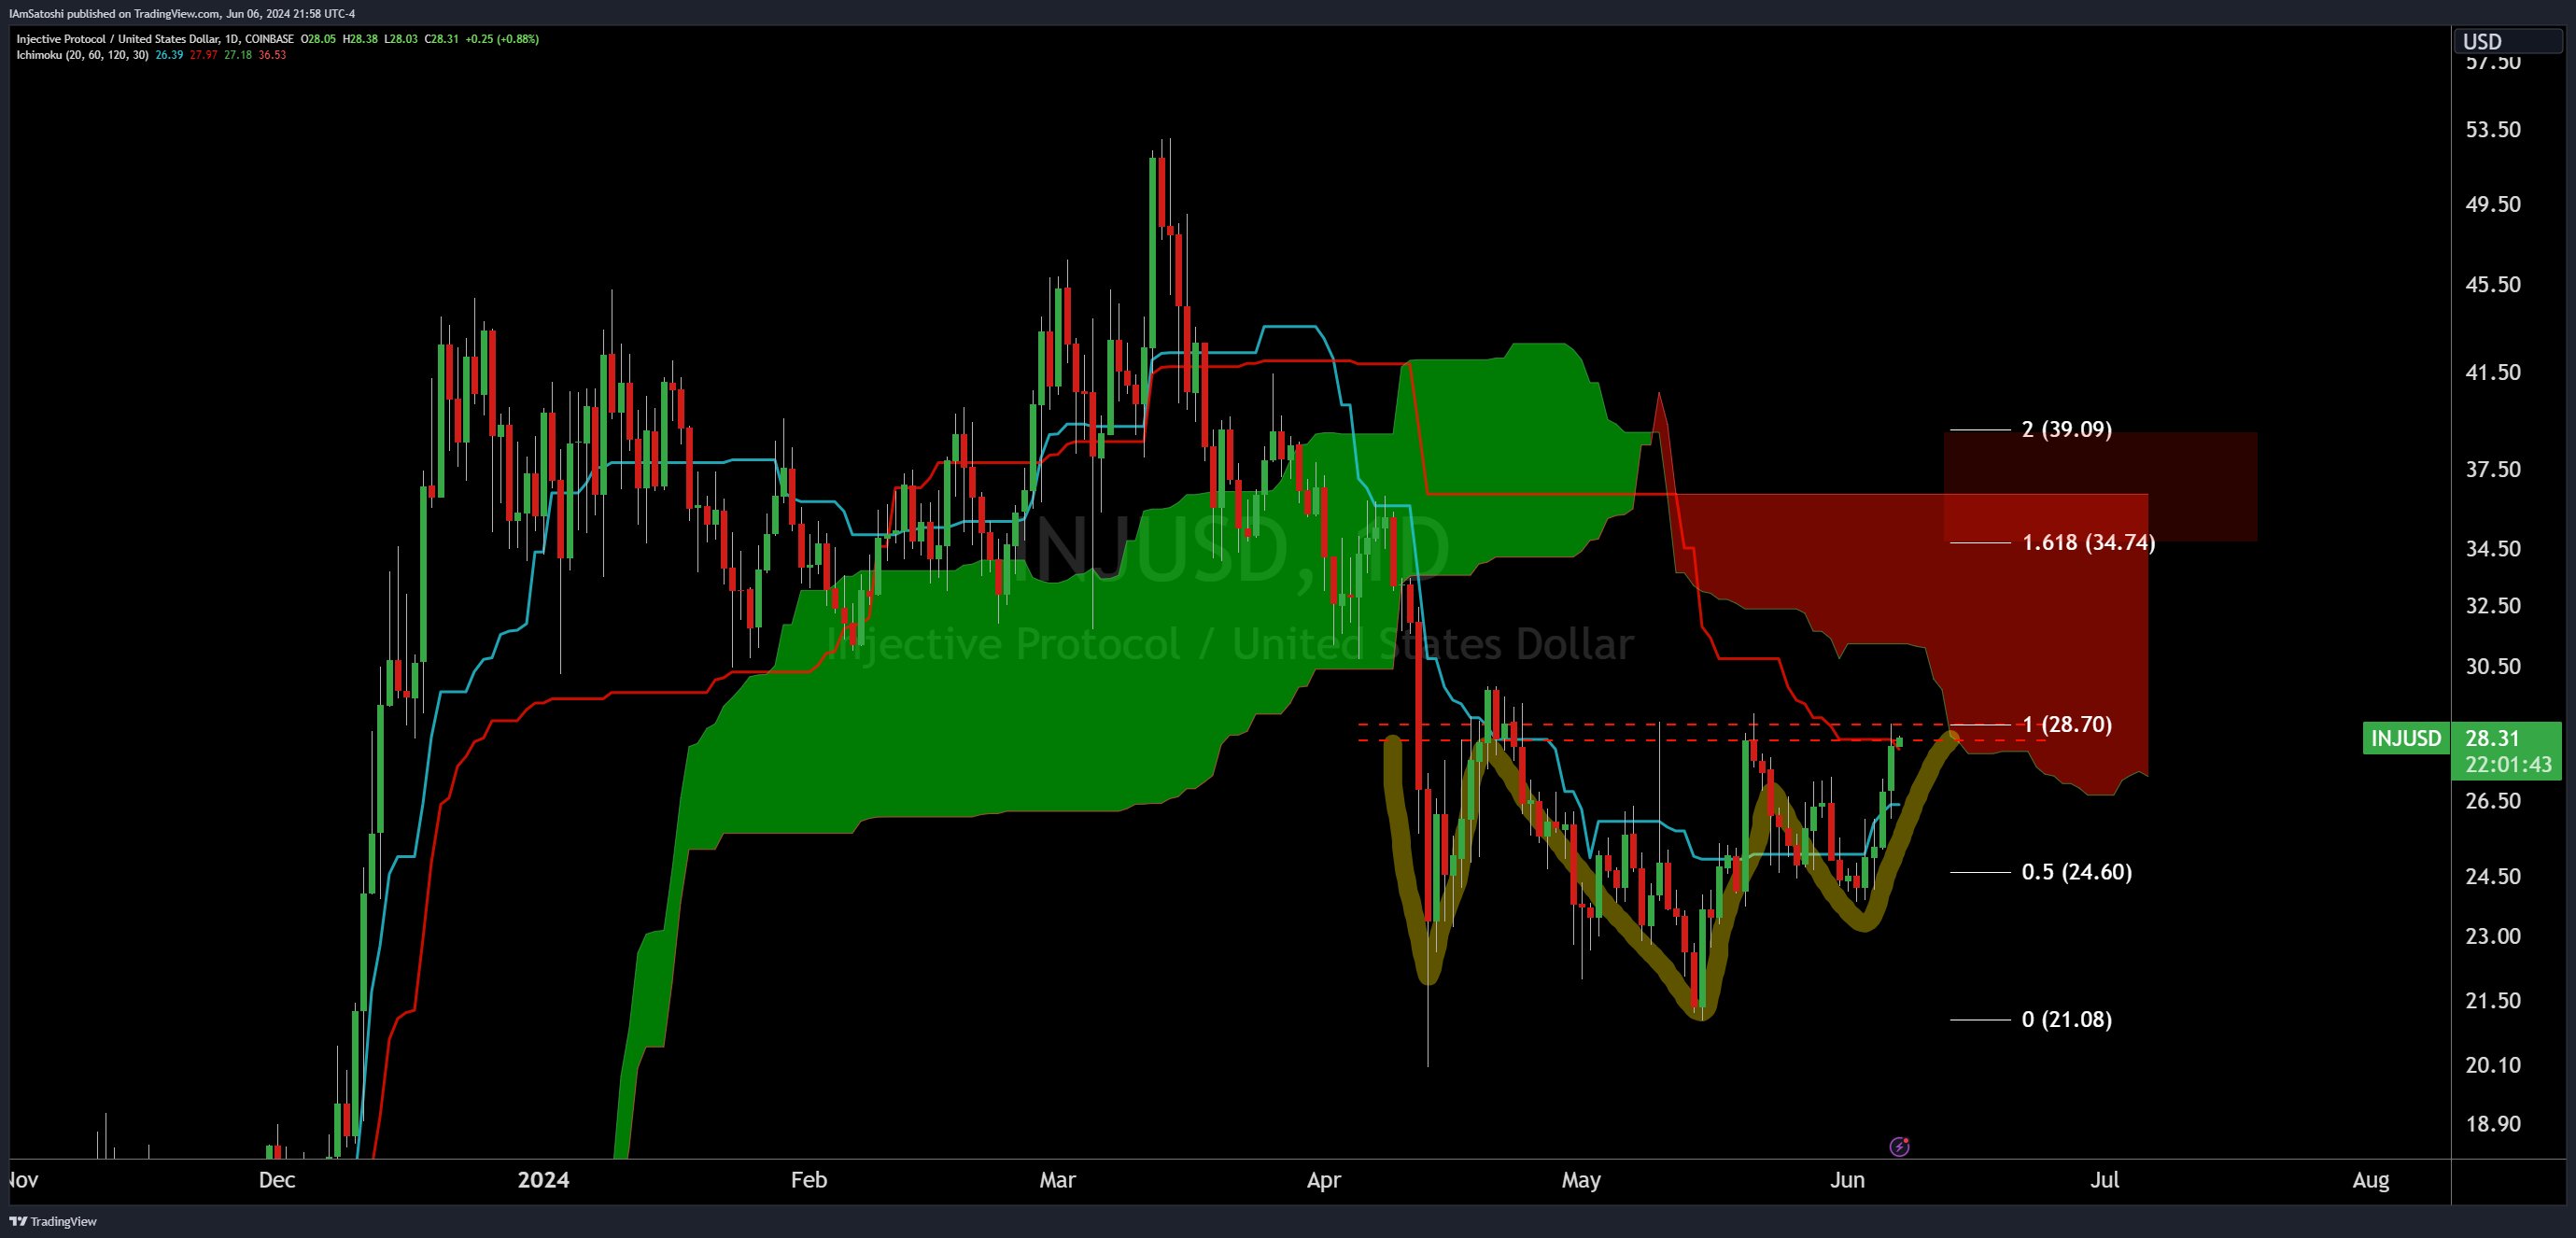
Injective price forecast: INJ chart points to a 46% jump
Injective price has crawled back since mid-May as traders watch its ecosystem grow after announcing recent events. The INJ token rose to $30 and is hovering near its highest levels since April 12. It has rebounded by over 60% from… дальше »
2024-6-14 19:09 | |
|
|
Solana On-Chain Indicators Suggests A Return Of Bullish Sentiment, Is It Time To Buy SOL?
Certain on-chain indicators paint a bullish picture for Solana (SOL), suggesting this may be an excellent time to purchase the crypto token. This aligns with Solana’s price movement on the chart, with technical analysts predicting that an upward trend might be on the horizon. дальше »
2024-6-14 17:00 | |
|
|
Toncoin (TON) Set For 40% Breakout: Buy At This Price, Says Crypto Analyst
In a technical analysis, crypto analyst Ali Martinez has identified a potential 40% breakout for Toncoin (TON), targeting an ambitious price point of $11. Martinez’s analysis, delivered through detailed chart reviews published on X, provides a robust case for TON’s impending price movement, underpinned by classical chart patterns and Fibonacci retracement levels. дальше »
2024-6-13 14:30 | |
|
|
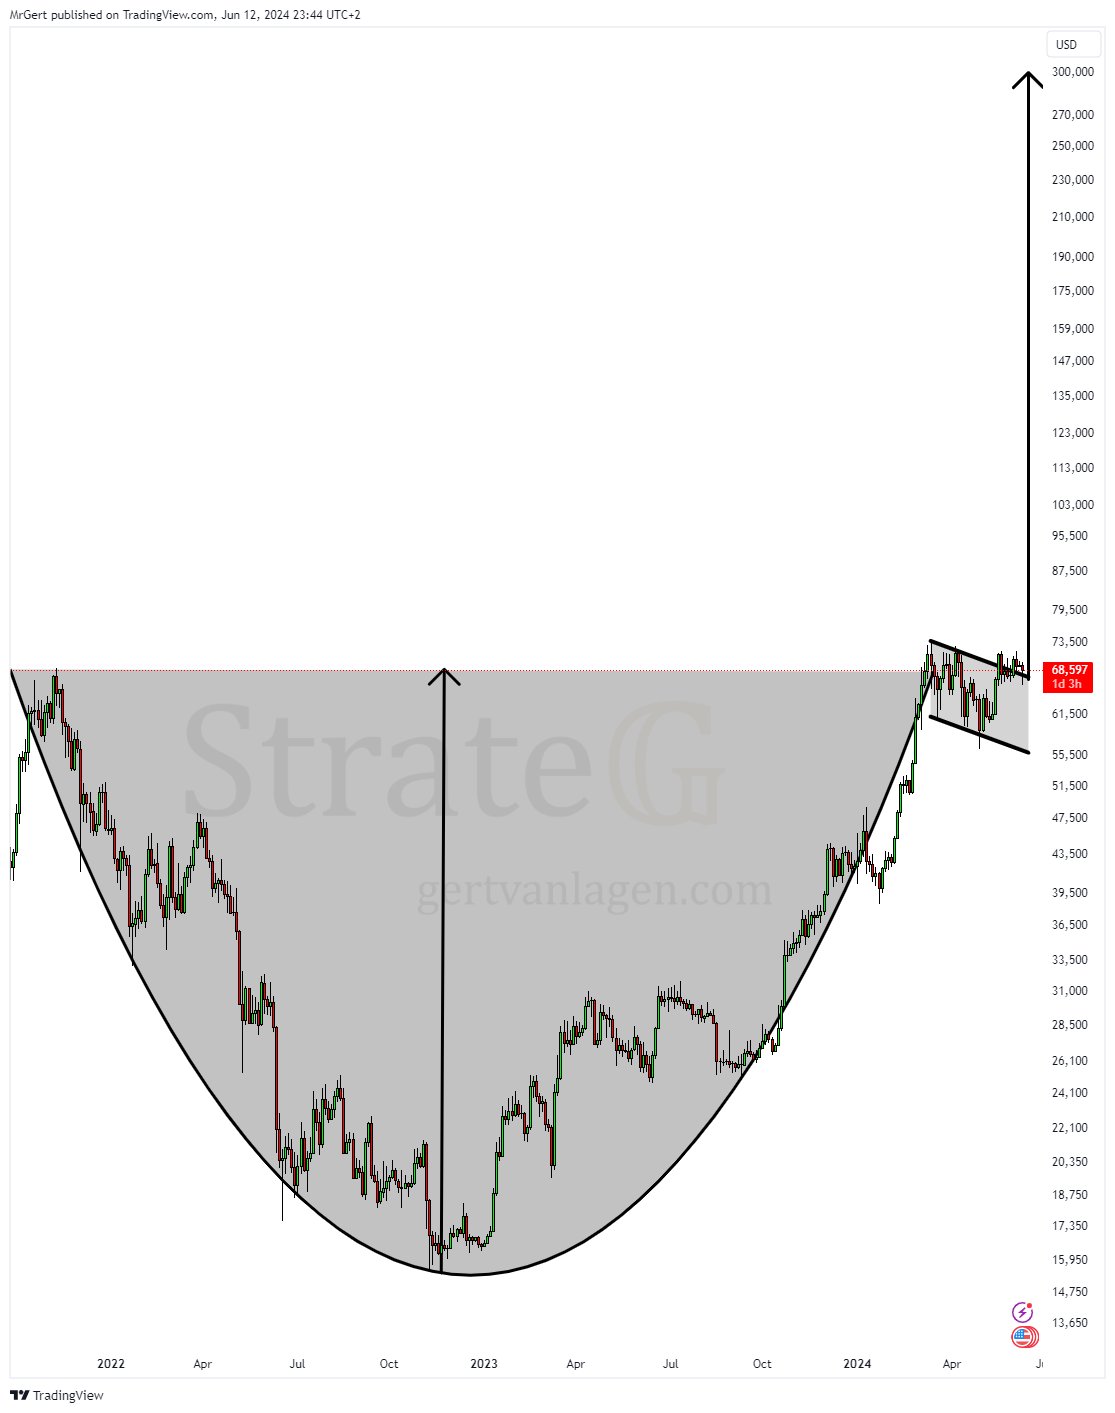
Bitcoin Price’s Path To $300,000 Cleared By Massive Bullish Pattern, Says Analyst
According to an analysis shared by renowned crypto analyst Gert van Lagen, the Bitcoin price chart has illustrated a significant technical pattern in the 3-day chart (BTC/USD) that could potentially signal an upsurge to as high as $300,000. дальше »
2024-6-13 11:45 | |
|
|
Is Now The Time To Buy Bitcoin? Latest Chart Analysis Says Yes – Here’s Why
Bitcoin has recently been spotlighted due to an intriguing buy signal identified on its hourly chart. This indication emerges amidst a notable fluctuation in Bitcoin’s price, setting the stage for potential short-term gains. дальше »
2024-6-12 23:00 | |
|
|

Is Bitcoin Crashing Because Of Miner Capitulation And Speculative BTC Bets?
Bitcoin is dumping when writing, cooling off from May highs of nearly $72,000. Down roughly 10% from all-time highs, there could be more losses on the way, at least looking at the candlestick arrangement in the daily chart. дальше »
2024-6-11 19:30 | |
|
|
TRON PRICE ANALYSIS & PREDICTION (June 11) – TRX Forms New Bullish Pattern Despite Market Drawdown, Up 5% Weekly
Against the latest market trends, TRX is up and strong on the daily chart following a consistent increase since last weekend. If trading volume increases, we can expect it to gain more traction in the next few days. дальше »
2024-6-11 17:58 | |
|
|
Crypto Analyst Says Kaspa Against Bitcoin is ‘Pure Beauty’ – KAS Price Rally Incoming?
Kaspa (KAS) has been having an impressive performance against Bitcoin (BTC), as the coin touched new all-time highs on June 5, 2024. According to LongTerm, a prominent crypto analyst, the KAS/BTC chart is a sight to behold, describing it as “pure beauty. дальше »
2024-6-11 13:30 | |
|
|
Hedge Funds Heavily Betting For Bitcoin To Fall: Will This Strategy Fail?
Looking at the formation in the daily chart, there is no relief for Bitcoin at spot rates. Following the flash crash on June 6, prices reversed sharply from the $72,000 level, further highlighting the significance of the liquidation level. дальше »
2024-6-11 20:30 | |
|
|
ETHEREUM PRICE ANALYSIS & PREDICTION (June 10) –ETH Eyeing $3,600 As The Next Crackdown Level, Can It Hold?
Ethereum’s ETH outlook remains bullish on the daily chart despite posting notable losses in the past week. However, it is currently on the verge of losing a key support level to retest a recently broken resistance line. дальше »
2024-6-11 17:37 | |
|
|

Notcoin (NOT) Develops Falling Wedge Triangle: Rally Looms?
Notcoin (NOT), a relatively new entrant in the cryptocurrency market, has recently formed a falling wedge pattern on its price chart. This technical formation is characterized by converging trendlines that slope downwards, signaling a potential bullish reversal. дальше »
2024-6-10 14:30 | |
|
|
Will Notcoin retest its ATH again? Watch out for this bullish pattern!
Notcoin fell by over 7% in the last 24 hours alone Bullish pattern emerged on NOT’s chart, hinting at a price hike Notcoin [NOT] was a much-hyped subject in the market, even before its lThe post Will Notcoin retest its ATH again? Watch out for this bullish pattern! appeared first on AMBCrypto. дальше »
2024-6-9 03:00 | |
|
|
Inverted Hammer Appears On The XRP Price Chart, Crypto Analyst Picks First Target Of $0.75
Crypto analyst Egrag Crypto has revealed a bullish pattern that recently formed on the XRP price chart. The analyst also revealed how high the crypto token could rise once it makes this move to the upside. дальше »
2024-6-8 23:00 | |
|
|
Injective’s INJ Resumes Journey to All-Time High After Breaking Crucial Resistance: Key Levels to Watch
Injective’s native token INJ has captured the attention of crypto traders as it resumed its journey towards reclaiming its all-time high. According to renowned crypto analyst Captain Faibik, a falling wedge breakout on the daily timeframe chart has been confirmed, signaling a potential rally to new record highs. дальше »
2024-6-8 21:15 | |
|
|

Polkadot (DOT) Forms Rising Wedge Pattern, Bullish Or Bearish?
Polkadot (DOT), a popular cryptocurrency in the blockchain space, has been making waves with its innovative approach to interoperability and scalability. However, like any financial asset, its price movement is subject to various technical analysis patterns, one of which is the rising wedge chart pattern. дальше »
2024-6-8 17:00 | |
|
|
Injective (INJ) Price Set To Skyrocket 33% On Classic Bullish Signal: Crypto Analyst
In an analysis shared on X, renowned crypto analyst Josh Olszewicz (@CarpeNoctom) forecasts a significant 33% rise in the price of Injective (INJ) based on a classic bullish chart pattern known as the inverted head and shoulders (iH&S). дальше »
2024-6-7 14:02 | |
|
|
Analyst Says Dogecoin Ready To See A Breakout Massive Whale Accumulation
Crypto analyst Kevin (Formerly OG Yomi) has highlighted a bullish pattern on the Dogecoin (DOGE) chart, which shows that a breakout is imminent. His prediction follows the recent wave of accumulation by DOGE whales, with these buys likely contributing to the potential breakout. дальше »
2024-6-7 03:00 | |
|
|
SOLANA PRICE ANALYSIS & PREDICTION (June 6) – Sol Looks Set For A Massive Rally But Can It Surpass This Resistance?
Sol is up today and is currently prime for a big move on the daily chart. It has dropped slightly from a daily high, looking for a key rebound level. Sol went through a nice recovery phase last month, posting roughly 50% gains in the first two weeks. It encountered […] дальше »
2024-6-7 23:57 | |
|
|
Polygon (MATIC) Breakout Likely: Strong Technical and Fundamental Indicators
As Polygon (MATIC) navigates a complex technical outlook, its recent price movements on the 1-day chart reveal both challenges and opportunities. The post Polygon (MATIC) Breakout Likely: Strong Technical and Fundamental Indicators appeared first on BeInCrypto. дальше »
2024-6-6 18:18 | |
|
|
Injective (INJ) Price Could Be on the Path to Reclaiming Recent Losses
Injective's price is close to breaching key resistance level given the investors are supporting a rise on the daily chart. The post Injective (INJ) Price Could Be on the Path to Reclaiming Recent Losses appeared first on BeInCrypto. дальше »
2024-6-6 17:00 | |
|
|
Solana Chart Follows the Same Pattern When SOL Price Pumped 100% – Here’s Analyst’s Outlook
Solana (SOL) has been quietly moving higher amidst the market’s focus on Bitcoin (BTC) and Ethereum (ETH). According to analyst Jelle, SOL is closely following the price action pattern observed in February and March, which suggests that new all-time highs could be on the horizon in the coming weeks. дальше »
2024-6-6 16:30 | |
|
|
Render (RNDR) Breaks Resistance: Crucial Next Move for Price
Render had been consolidating within a narrow trading range characterized by low volatility. During this period, the 200 EMA (in Green) on the 4-hour chart acted as a crucial support level. The post Render (RNDR) Breaks Resistance: Crucial Next Move for Price appeared first on BeInCrypto. дальше »
2024-6-6 15:39 | |
|
|
ORDINAL PROTOCOL PRICE ANALYSIS & PREDICTION (June 5) – ORDI Surges To A New Multi-Week High, Aiming For April’s High
Following a slow and steady monthly increase, Ordi initiated a notable surge today and flipped through a crucial resistance to a new multi-week level. It currently looks bullish, set for a strong recovery on the daily chart. дальше »
2024-6-5 08:19 | |
|
|
Bitcoin Ready To Takeoff? Analyst Eyes $85,000 as Fundamentals Align
Bitcoin prices are hovering near $70,000, bouncing from a critical dynamic support line, evident in the daily chart. Even though bulls have yet to breach $72,000 and break above March 2024 highs, traders are optimistic about what lies ahead. дальше »
2024-6-5 20:30 | |
|
|
Crypto Whale Splashes $3M on PEPE as Top Analyst Claims ‘Cleanest Chart’ in Meme Coin Rally
A fresh wallet has withdrawn a substantial amount of PEPE tokens from Binance, signalling a growing interest in the meme coin. This development coincides with PEPE’s price surge, reflecting its increasing popularity among crypto enthusiasts. дальше »
2024-6-3 22:30 | |
|
|
POLKADOT PRICE ANALYSIS & PREDICTION (June 3) – DOT Poises For Buy Following This Bullish Pattern, Can It Retake Previous High
Starting this week on a bearish note, Polkadot DOT appeared to have found support but is yet to bounce back on the daily chart. A big price movement should be expected soon following a fresh bullish setup daily. дальше »
2024-6-3 15:36 | |
|
|
Bitcoin could top $150k in Q3 2025, chart veteran Peter Brandt says
Should past bull markets indicate how things will unfold today, Bitcoin could set its all-time high for the current bull cycle in 2025. Peter Brandt, a well-known analyst focused on interpreting chart patterns, says Bitcoin is likely to set its… дальше »
2024-6-3 12:29 | |
|
|
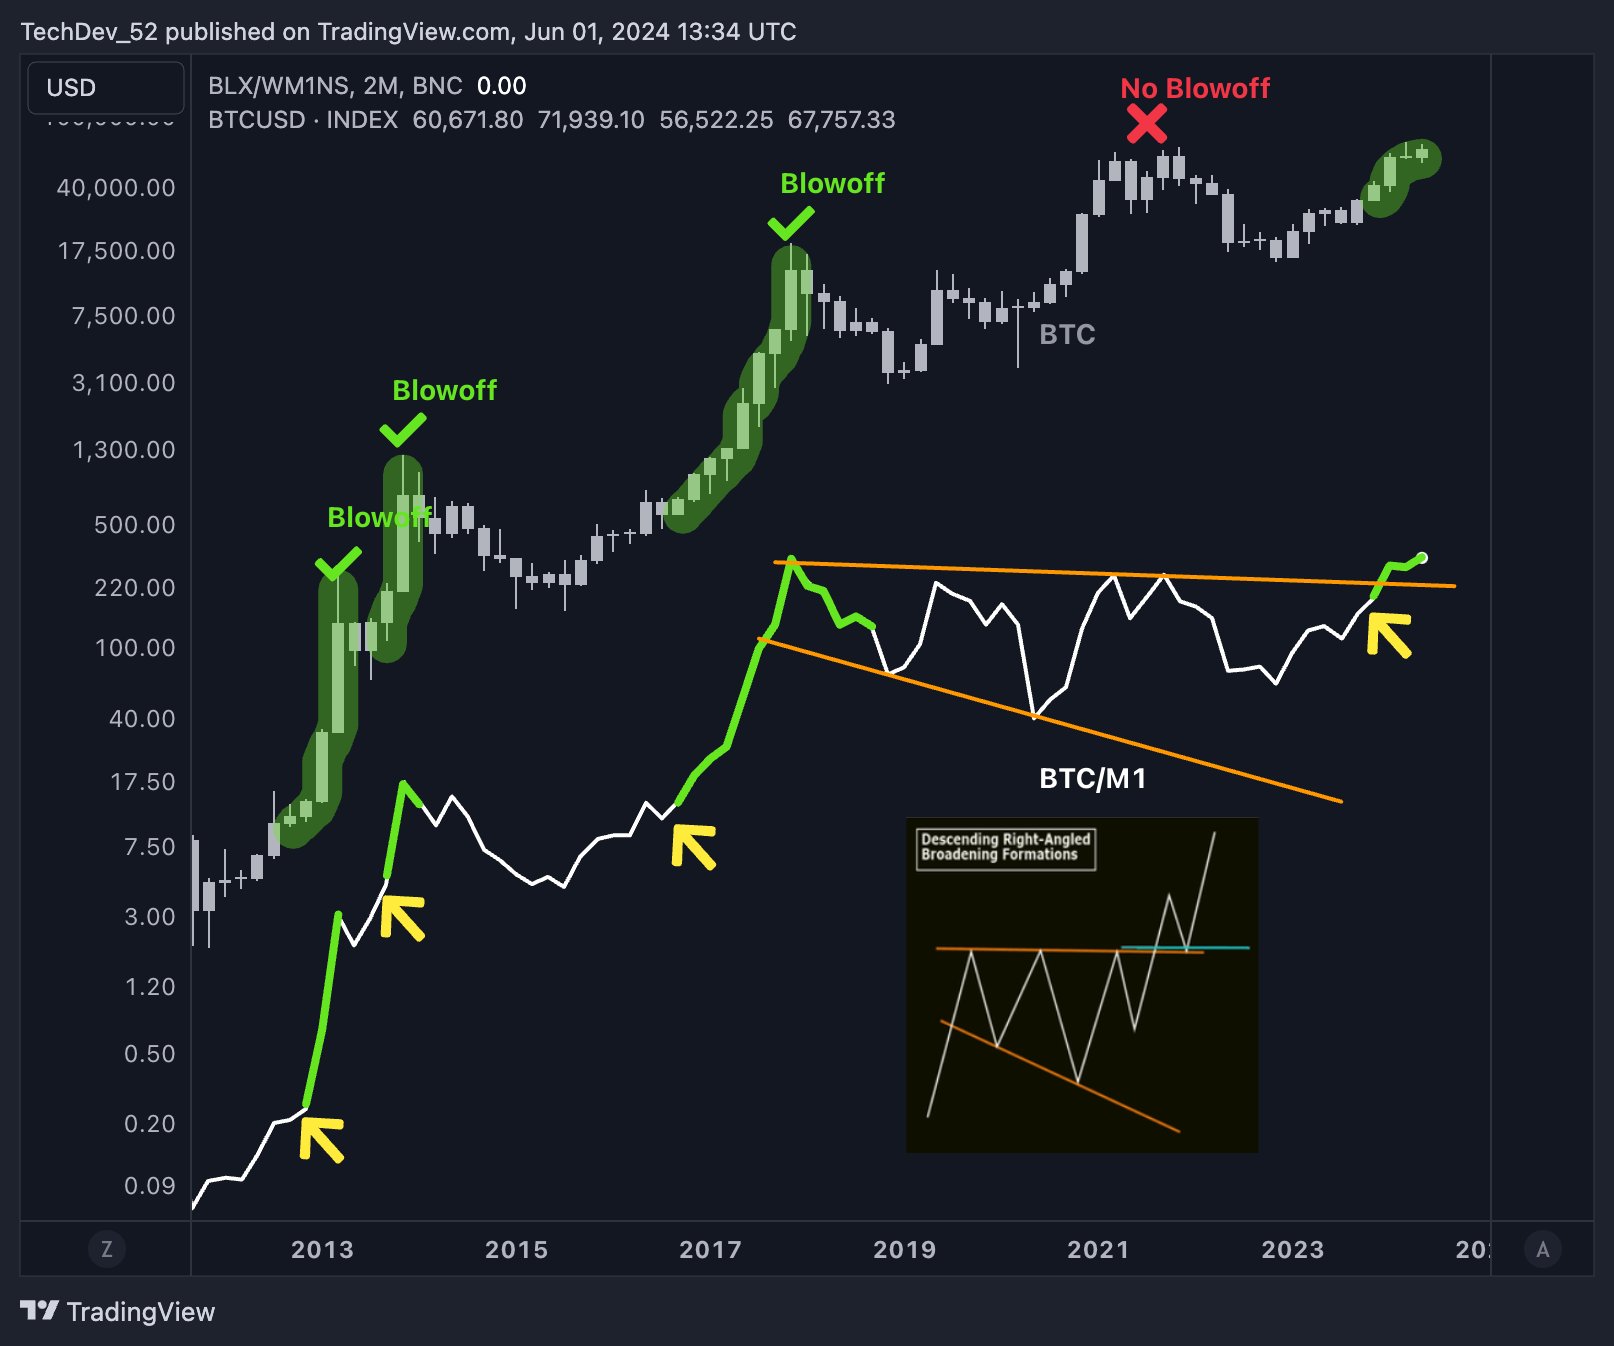
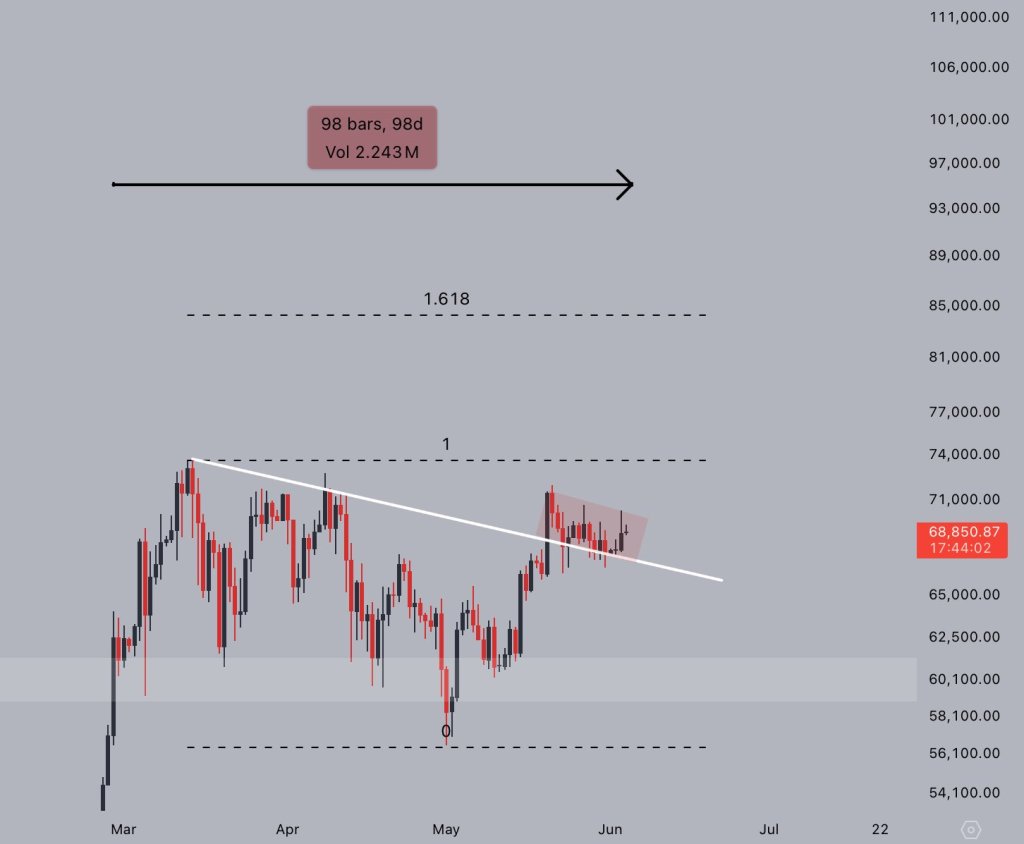
Is This The Biggest Bitcoin Bull Run Ever? Analyst Says Yes!
Crypto analyst TechDev (@TechDev_52) recently shared a detailed chart analysis suggesting that Bitcoin might be on the cusp of its most significant breakout to date. This analysis, backed by historical patterns and technical indicators, points to a potential shift in the market that could lead to unprecedented price levels for Bitcoin. дальше »
2024-6-3 10:50 | |
|
|
Is Solana Summer Already Over? Caitlyn Jenner and Iggy Azalea Meme Coins Flop As Rollblock Continues To Surge
In the past few months, the name “Solana” has gained wide popularity in the crypto market not because of its fast network but due to the rise of Solana-based meme coins which soared up the price chart, posing a major threat to top meme coins. дальше »
2024-6-3 10:00 | |
|
|
AVALANCHE PRICE ANALYSIS & PREDICTION (May 31) – Avax Continues To Look For Support As It Declines 4% Weekly
Following the mid-month surge that led to a false breakout last week, Avax fell back into a range and continued to show signs of weakness. It is currently looking for key support to initiate a buy on the daily chart. дальше »
2024-6-1 20:50 | |
|
|
Ethereum Hints at New ATH; FLOKI Picks Up Momentum; RECQ Hailed as the Next Alpha By Experts
TLDR The approval of spot Ethereum ETFs—the first altcoin to be wrapped in an ETF—is bullish for the entire crypto community, especially the DeFi powerhouse. Its chart hints at a new all-time high (ATH), making it one of the most compelling altcoins to buy and HODL. дальше »
2024-5-31 22:00 | |
|
|
SOLANA PRICE ANALYSIS & PREDICTION (May 30) – Is Sol Reaccumulating For A Massive Run Following This New Bullish Pattern?
The past few days saw Sol through a slight pullback after testing a key level last week. However, it has found solid support but is yet to initiate a major buy following a new bullish pattern on the daily chart. дальше »
2024-5-31 17:56 | |
|
|
Bitcoin miner capitulation: 14 days in, compared to 41-day average over the past 5 years
Quick Take The Hash Ribbon chart by Glassnode is a market indicator that identifies potential bottoms in Bitcoin’s price by analyzing miners’ behavior. Specifically, it suggests that Bitcoin reaches a bottom when miners capitulate, meaning mining becomes unprofitable relative to the costs. дальше »
2024-5-30 19:50 | |
|
|
Bitcoin Rainbow Chart tells you that NOW is the time to buy BTC - Is it?
The Bitcoin Rainbow chart entered the “buy” zone after 2020 and 2024 halvings. Market indicators hinted at a price decline in the coming days. Investors’ confidence in Bitcoin [BTCThe post Bitcoin Rainbow Chart tells you that NOW is the time to buy BTC - Is it? appeared first on AMBCrypto. дальше »
2024-5-28 03:00 | |
|
|
ETH/BTC Bounces From A 7-Year Support Trend Line: Ethereum To $4,900?
After a crucial week for Ethereum, a technical candlestick arrangement shows that ETH prices could prepare for a sharp upturn in the coming weeks and months. Pointing out events in the monthly chart, one analyst notes that the ETH/BTC ratio reverses from a multi-year support trend line. дальше »
2024-5-28 22:30 | |
|
|
Can Cardano rebound from its April crash? Price chart suggests...
Market sentiment around ADA continued to remain bearish. Apart from a bull pattern, a few of the metrics hinted at a price uptick Cardano [ADA] disappointed investors over the last few mThe post Can Cardano rebound from its April crash? Price chart suggests... appeared first on AMBCrypto. дальше »
2024-5-27 22:00 | |
|
|


BNB Forms Bullish Flag Pattern On 1-Day Chart – What’s Next?
After a rally to create an all-time high, the price of Binance Coin (BNB) has been in a consolidation zone. During this consolidation, BNB’s price has managed to form a bullish triangle flag above the 100-day Simple Moving Average (SMA) in the 1-day timeframe. дальше »
2024-5-26 00:00 | |
|
|
CONSTITUTION DAO PRICE ANALYSIS & PREDICTION (May 25) – People Taps New High After Exploding 400%, But Now Faces Rejection
People saw a massive surge in the past weeks and reached a significant milestone following another 10% daily increase. It looks strongly bullish on the day but is now showing signs of weakness on the daily chart. дальше »
2024-5-26 23:20 | |
|
|
Solana indicators show low demand - Should you be worried?
Solana has breached an imbalance on the daily chart and could retest it as a support zone. The momentum and price action signaled bulls were in control of the market. Solana [SOL] saw a spikThe post Solana indicators show low demand - Should you be worried? appeared first on AMBCrypto. дальше »
2024-5-24 20:00 | |
|
|
Bollinger Bands Inventor Foresees Bitcoin Pullback: Key Levels To Watch
Renowned financial analyst John Bollinger has recently issued a caution regarding the potential for a Bitcoin pullback. After BTC price surged from below $66,000 to almost $72,000 at the beginning of the week, Bollinger, the creator of the widely utilized Bollinger Bands indicator, pointed to specific features in the Bitcoin price chart that suggest a consolidation or pullback could be imminent, though he clarified that his perspective was not bearish on a longer term. дальше »
2024-5-22 14:00 | |
|
|
DeFi tokens brace for Ethereum ETF decision: What's at stake?
The DeFi sector’s price chart performance was muted ahead of the ETH ETF deadline. Ethereum’s sentiment will affect the next price direction for most DeFi tokens. The DeFi narrative The post DeFi tokens brace for Ethereum ETF decision: What's at stake? appeared first on AMBCrypto. дальше »
2024-5-20 20:00 | |
|
|
Technicals Reveal Ripple’s XRP Price May Break Out Above $1.5 and Rally to $7.5 – Here’s How
A new technical formation takes shape on the Ripple (XRP) price chart, which has renewed the possibility of a potential surge. According to EGRAG Crypto, a renowned crypto analyst, a white Triangle pattern is emerging, incorporating highs from 2021, and it heralds the arrival of the “Genuine Wake-Up Line” – a potential catalyst for a […] The post Technicals Reveal Ripple’s XRP Price May Break Out Above $1. дальше »
2024-5-20 11:45 | |
|
|
BITCOIN CASH PRICE ANALYSIS & PREDICTION (May 19) – BCH Faces Resistance After A Week Bounce, Can It Scale Through?
Bitcoin Cash increased by 13% in the past week after establishing base support above a key level. It has formed a bullish pattern on the daily chart, negotiating the next major rally as it faces a minor resistance. дальше »
2024-5-20 23:48 | |
|
|