2021-10-15 18:30 |
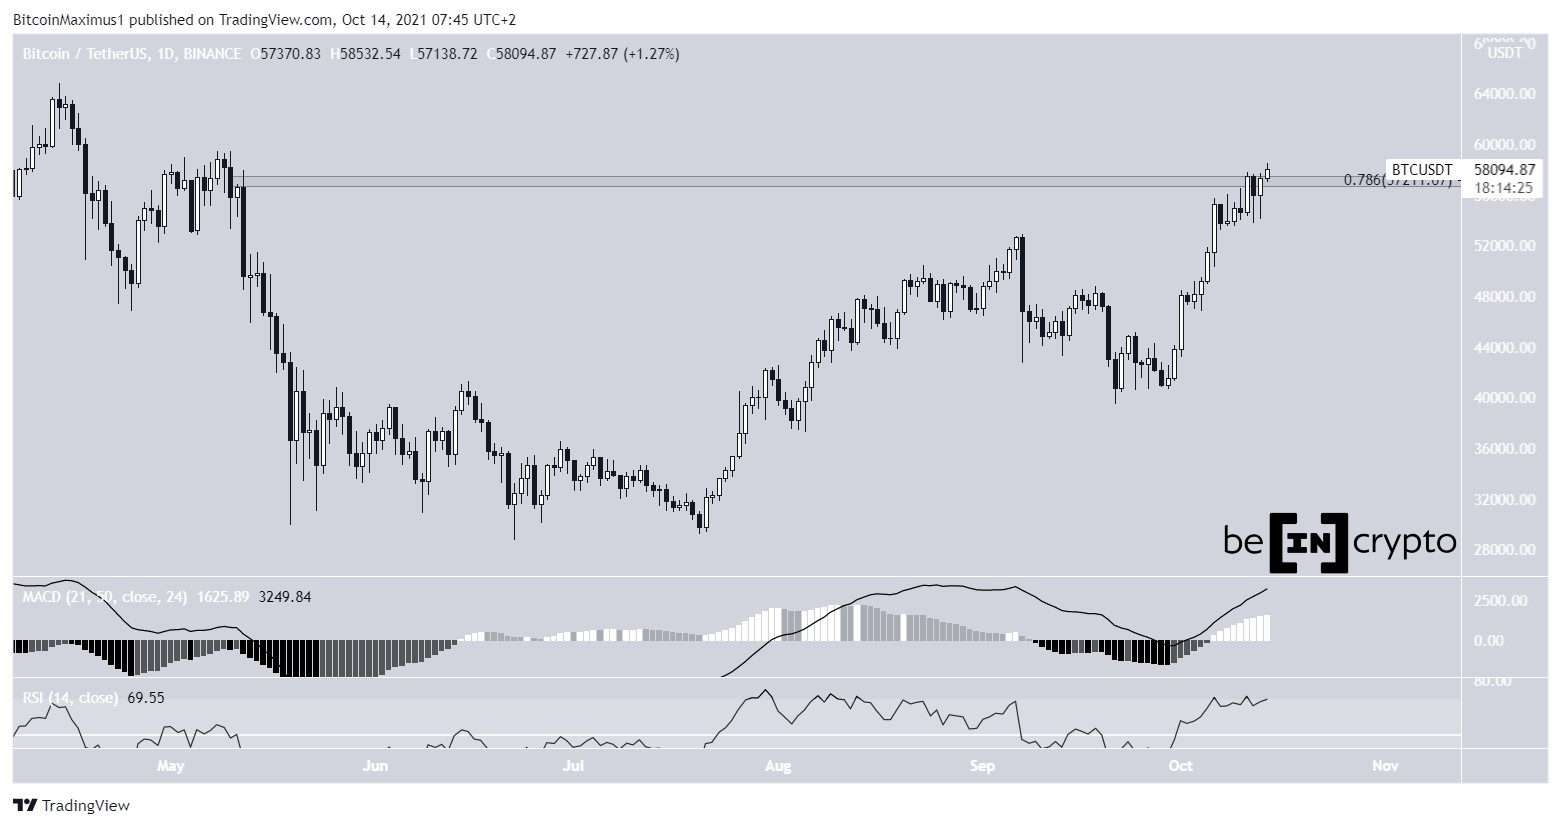
Bitcoin (BTC) has moved above the $57,200 resistance area while Ethereum (ETH) is in the process of breaking out from the $3,630 resistance area.
XRP (XRP) has broken out from a descending resistance line.
Zcash (ZEC) has broken out from a descending wedge.
Ankr (ANKR) has broken out from a descending parallel channel.
Polkadot (DOT) is trying to break out from a horizontal resistance level.
Kusama (KSM) has bounced at the $300 support area.
BTCOn Oct 13, BTC reversed its initial drop and created a long lower wick. This is seen as a sign of buying pressure, since the lower prices were not sustained. Rather, BTC reversed and moved above the $57,200 resistance.
This is a crucial development, since the $57,200 area is both a horizontal resistance area and the 0.786 Fib retracement resistance level. In addition to this, it is the final resistance prior to a new all-time high.
Technical indicators in the daily time-frame provide a bullish outlook. Firstly, the MACD is increasing and is in positive territory. This shows that the short-term trend is faster than the long-term one, and is also accelerating at a faster rate.
The RSI, which is a momentum indicator, is back above the 70 line. This shows that the trend is bullish, even though it is overbought.
So, the daily time-frame readings indicate that the trend is bullish.
Chart By TradingView ETHOn Oct 1, ETH broke out from an ascending parallel channel. This validated the ongoing increase that has been going on since Sept 1. Therefore, it confirmed that the previous downward movement had come to an end.
On Oct 4, 11 and 13, ETH bounced at the resistance line of the channel (blue icon). This means that the resistance line is now expected to act as support.
After the final bounce, the token initiated an upward movement and is now in the process of moving above the $3,630 resistance area.
A breakout above it would be expected to trigger a sharp upward movement towards the Sept highs and above.
The RSI supports this move, since it has just moved above 50 (green icon). The previous time it did so, ETH broke out from the channel.
Chart By TradingView XRPOn Oct 9, XRP broke out from a descending resistance line, confirming that the previous downward movement had come to an end.
Afterwards, it was rejected by the $1.20 resistance area, which is the 0.618 Fib retracement level. This is the most common Fib level that provides resistance.
However, the token bounced at the $1.20 support area afterwards (green circle). The support area is created by the previous descending resistance line, which is now expected to act as support.
A breakout above the $1.20 area would likely take XRP towards its Sept highs.
Chart By TradingView ZECZEC had been decreasing inside a descending wedge since Sept 16. The wedge is considered a bullish pattern, meaning that the price is likely to break out most of the time.
Unsurprisingly, ZEC broke out on Oct 2, leading to a high of $129.6 on Oct 6.
While the token has been decreasing since, it bounced at the $112 support area. The area had previously acted as resistance, while it turned to support after the breakout.
The second bounce, which occurred on Oct 12, further increased its significance.
The closest resistance area is between $138-$147. It is created by the area between the 0.5-0.618 Fib retracement resistance level.
Chart By TradingView ANKRANKR has been trading inside a long-term descending parallel channel since March 28, when it had reached an all-time high price of $0.216.
Parallel channels usually contain corrective movements. This means that the decrease was likely to be corrective, thus a breakout would be expected.
On Aug 22, ANKR broke out from the channel, proceeding to reach a high of $0.135. While it decreased afterwards, it bounced at the $0.078 area. The area previously acted as resistance, and the bounce validated it as support.
As long as the token is trading above this level, the trend is considered bullish and ANKR is expected to move towards new highs.
Chart By TradingView DOTDOT has been increasing alongside an ascending support line since July 19.
More recently, it bounced thrice at the line (green icons), on Sept 7, 21 and Oct 6. The bounces served to increase the significance of the line, which is measuring the rate of increase for the trend.
The ensuing upward movement took DOT to the $41.35 resistance.
This is a crucial resistance area, since it is the final one prior to a new all-time high price.
Therefore, if DOT manages to break out, it would be expected to increase towards a new all-time high.
Chart By TradingView KSMKSM has been increasing since breaking out from a descending resistance line and bouncing on it on Aug. 27 (green icon). The bounce served to validate the line as support, and indicated that the previous downward movement had come to an end.
However, the token failed to move above the 0.618 Fib resistance level at $440, and was rejected. Afterwards, it found support at $300 and began the current bounce.
Therefore, KSM is expected to make another attempt at breaking out above $440.
Chart By TradingViewFor BeInCrypto’s latest Bitcoin (BTC) analysis, click here.
The post Multi Coin Analysis: DOT Could Soon Reach New All-Time High as ETH Pushes Higher appeared first on BeInCrypto.
origin »Bitcoin price in Telegram @btc_price_every_hour
Time New Bank (TNB) íà Currencies.ru
|
|


