2021-5-18 17:30 |
Iota (IOTA) is trading inside a symmetrical triangle, from which a breakout is expected.
Stellar (XLM) is moving upwards, attempting to break out from an ascending parallel channel.
Tron (TRX) is trading inside a symmetrical triangle. A breakout from this pattern is expected.
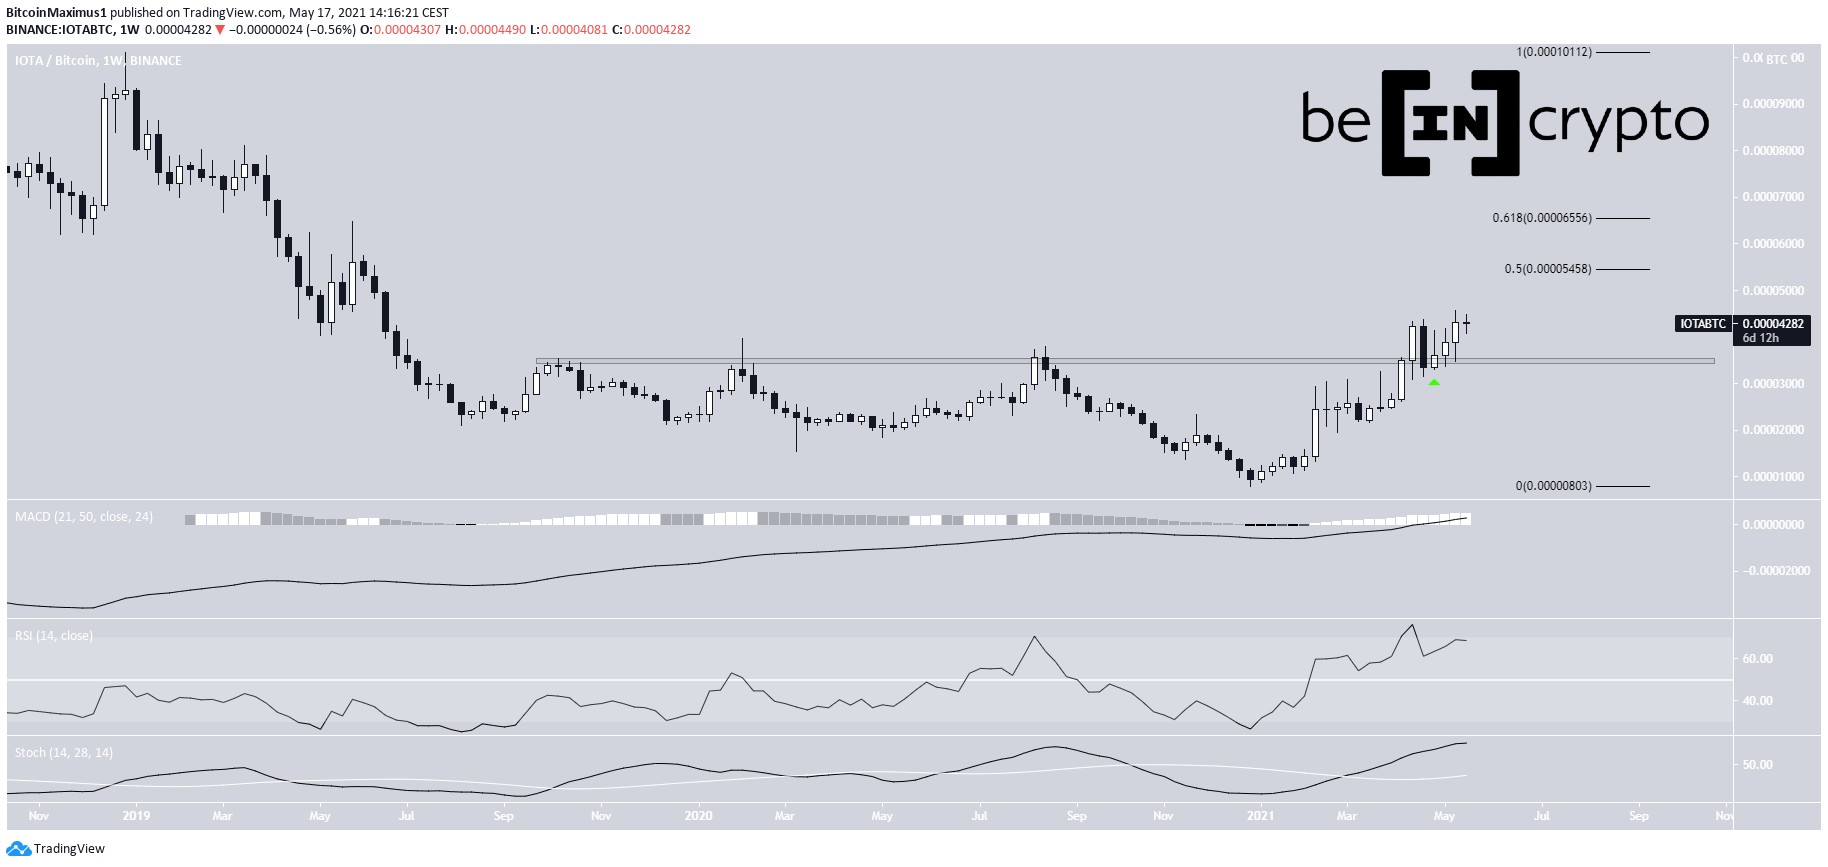
IOTAIOTA/BTC has been moving upwards since December 2020. At the beginning of May 2021, it managed to break out above the 3,500 satoshi area. Afterwards, it returned in order to validate it as support (green arrow). Since then, it has been moving upwards.
The next closest resistance levels are found at 5,450 and 6,550 satoshis. These are the 0.5 and 0.618 Fib retracement levels, measuring from the most recent downward movement.
The MACD, RSI, and Stochastic Oscillator are increasing, supporting the possibility that the price increases towards these levels.
Chart By TradingViewThe IOTA/USD pair looks similarly bullish. While the token has been decreasing since April 16, it seems to be in wave four of a five wave bullish formation. Wave four has taken the shape of a symmetrical triangle.
If the price breaks out, which is expected, the next closest resistance levels would be found at $3.30 and $4.25, respectively.
Chart By TradingView Highlights IOTA/BTC has reclaimed the 3,500 satoshi area. IOTA/USD is trading inside a symmetrical triangle. XLMXLM/BTC has been moving upwards since the beginning of the year. After four failed attempts, it managed to break out from 1,050 satoshi resistance area, last week.
The next resistance areas are found at 2,000 and 3,000 satoshis.
Technical indicators are bullish, supporting the continuation of the upward movement. This is especially evident by the RSI cross above 70 and the bullish cross in the Stochastic Oscillator.
Chart By TradingViewThe XLM/USD pair shows that the price is attempting to break out form an ascending parallel channel. Prior to this, it had been moving upwards since April 23, after it completed a running flat correction.
As a result, the most likely target for the top of the current upward movement is found at $0.94. However, if the movement extends, possible targets are found at $1.10 and $1.30, respectively.
Chart By TradingView Highlights XLM/BTC has broken out from the 1,050 satoshi resistance area. XLM/USD is attempting to break out from an ascending parallel channel. TRXTRX/BTC has been moving upwards at an accelerated rate since March 31. Shortly afterwards, it managed to break out from the 222 satoshi area and validate it as support.
Technical indicators are bullish.
The MACD has given a bullish reversal signal while the RSI has generated hidden bullish divergence. Therefore, the token is expected to move towards the next resistance area at 315 and 465 satoshis afterwards.
Chart By TradingViewThe price movement for TRX/USD is very similar to IOTA. TRX is also trading inside a symmetrical triangle. Furthermore, this is likely to be wave four of a bullish impulse.
Potential targets for the top of the upward movement are found at $0.226 and $0.288, respectively. However, they depend on the exact bottom of wave four, which has not been reached yet. So, they are likely to be adjusted slightly based on the actual bottom.
Chart By TradingView Highlights TRX/BTC has reclaimed the 222 satoshi resistance area TRX/USD is trading inside a symmetrical triangle.For BeInCrypto’s latest bitcoin (BTC) analysis, click here.
The post Mid-Caps Prepare for Explosive Movements After BTC Correction appeared first on BeInCrypto.
origin »Bitcoin price in Telegram @btc_price_every_hour
Bitcoin (BTC) на Currencies.ru
|
|
