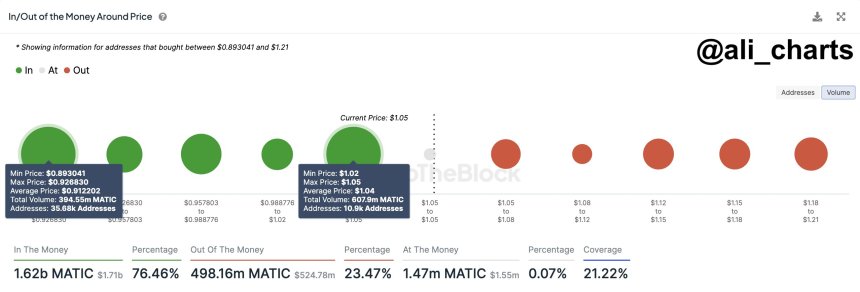
2022-11-7 10:47 |
MATIC price started a major increase from the $0.840 support zone. Polygon buyers pumped the price above $1.20 and there could be more upsides.
MATIC price rallied above the $1.00 and $1.20 resistance levels against the US dollar. The price is trading well above $1.00 and the 100 simple moving average (4-hours). There is a key contracting triangle forming with resistance at $1.22 on the 4-hours chart of the MATIC/USD pair (data source from Kraken). The pair could continue to rise and might soon revisit the $1.50 resistance zone. Polygon’s MATIC Price Rallies SteadilyAfter forming a base above the $0.800 level, polygon’s price started a fresh increase. MATIC price broke the $0.880 and $0.980 resistance levels to move into a positive zone.
There was a strong move above the $1.00 resistance and the 100 simple moving average (4-hours). Finally, the price surged above the $1.20 resistance. A high was formed near $1.304 and the price recently started a downside correction, similar to bitcoin and ethereum.
There was a move below the $1.22 and $1.20 levels. The price declined below the 23.6% Fib retracement level of the upward move from the $0.838 swing low to $1.304 high.
However, matic bulls are active above the $1.15 level. There is also a key contracting triangle forming with resistance at $1.22 on the 4-hours chart of the MATIC/USD pair. On the upside, an immediate resistance is near the $1.22 zone.
Source: MATICUSD on TradingView.com
The first major resistance is forming near the $1.240 zone. The main resistance is now forming near the $1.300 level. If there is an upside break above the $1.300 and $1.304 resistance levels, the price could start another strong increase. In the stated case, the price could rise steadily towards the $1.50 level.
Dips Limited in MATIC?If MATIC price fails to continue higher above the $1.22 or $1.24 levels, it could start a downside correction. An immediate support on the downside is near the $1.150 level.
The main support is near the $1.060 level. A downside break below the $1.060 level could open the doors for a fresh decline towards $0.950 or the 100 simple moving average (4-hours). The next major support is near the $0.850 level.
Technical Indicators
4-hours MACD – The MACD for MATIC/USD is slowly losing momentum in the bullish zone.
4-hours RSI (Relative Strength Index) – The RSI for MATIC/USD is now above the 50 level.
Major Support Levels – $1.15 and $1.060.
Major Resistance Levels – $1.22, $1.24 and $1.30.
origin »Bitcoin price in Telegram @btc_price_every_hour
ETH/LINK Price Action Candlestick Set (LINKETHPA) на Currencies.ru
|
|


