2020-1-24 19:27 |
Litecoin saw a substantial amount of value transferred on its network throughout 2019. As the cryptocurrency market appears to have entered a new bull run, this year looks even more promising for LTC.
Litecoin’s Massive Network ActivityAccording to a recent report by BitInfoCharts, over $100 billion worth of LTC were transacted over the Litecoin blockchain last year.
The high amount of value transferred is particular since the cryptocurrency has entered a bearish trend in the second half of 2019.
Litecoin plumetted over 75% from a high of $147 in late June to a low of $36 in mid-December. Despite the downturn in the market in the second half of the year, there were approximately $200 to $300 million in daily transactions on average from January to July 2019.
Meanwhile, the level of interest among non-speculative investors grew significantly. It formed a base around $100 million in transactions per day within a steady amount of 21,000 transactions. Thus, the average transaction value sat at $5,000 per transaction.
The median transaction value was, however, only around $50 per transaction. Such an enormous discrepancy suggests that “the majority of value is from a small number of high net worth individuals, funds or services,” according to the report.
Although $100 billion in value transferred sounds like a huge amount of money, this is nothing compared to what was seen during the bull market of 2017. At its peak, over $5 billion were transacted in a single day.
Based on this data, it appears like the higher the price of LTC, the higher the amount of value transferred. Under this premise, a look at Litecoin’s price action could suggest how its network activity will behave in 2020.
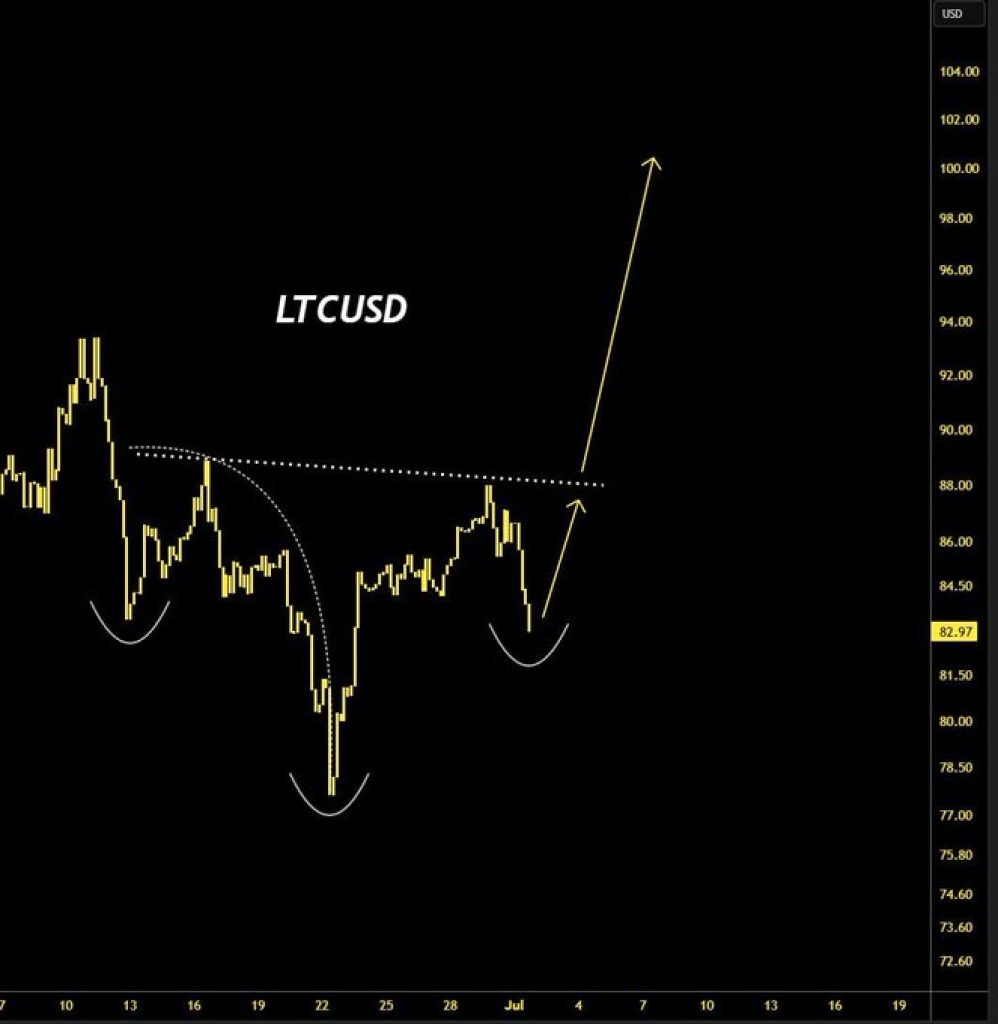
A Bull Rally Could Be UnderwayBased on the 1-week chart, multiple technical indicators estimate that Litecoin may soon enter a massive bull rally.
The parabolic stop and reverse, or “SAR,” presented a buy signal over three weeks ago. Each time the stop and reversal points move below the price of an asset, it is considered to be a positive sign. Such a bullish formation indicates that the direction of LTC’s trend changed from bearish to bullish.
This is the first time since February 2019 that the stop and reversal system turns bullish. During that time, Litecoin skyrocketed 350% after the parabolic SAR presented the bullish signal.
LTC/USD by TradingViewAdditionally, the moving average convergence divergence, or MACD, also turned bullish recently adding credence to a further advance. This technical indicator follows the path of a trend and calculates its momentum.
As the 12-day EMA crossed above the 26-day EMA, the odds for a further upward push increased.
LTC/USD by TradingViewDespite these bullish signs presented on LTC’s 1-week chart, there is one missing factor that could be considered the final nail in the coffin.
At the moment, the 200-week moving average is serving as resistance. Based on historical data, each time Litecoin turned this moving average into support a new macro uptrend was triggered. Thus, the moment this cryptocurrency is able to break above this significant price hurdle one could expect the beginning of a bull run.
LTC/USD by TradingViewBased on the previous technical analysis, it seems like a significant amount of value would likely be transferred over the Litecoin network this year as well. The only thing that could impede this outlook is the strength of the 200-week moving average.
Until this barrier breaks, one should expect lower lows
The post Litecoin’s Network Activity Could Explode as LTC Turns Bullish appeared first on Crypto Briefing.
origin »Bitcoin price in Telegram @btc_price_every_hour
Litecoin (LTC) на Currencies.ru
|
|
