2020-11-12 20:16 |
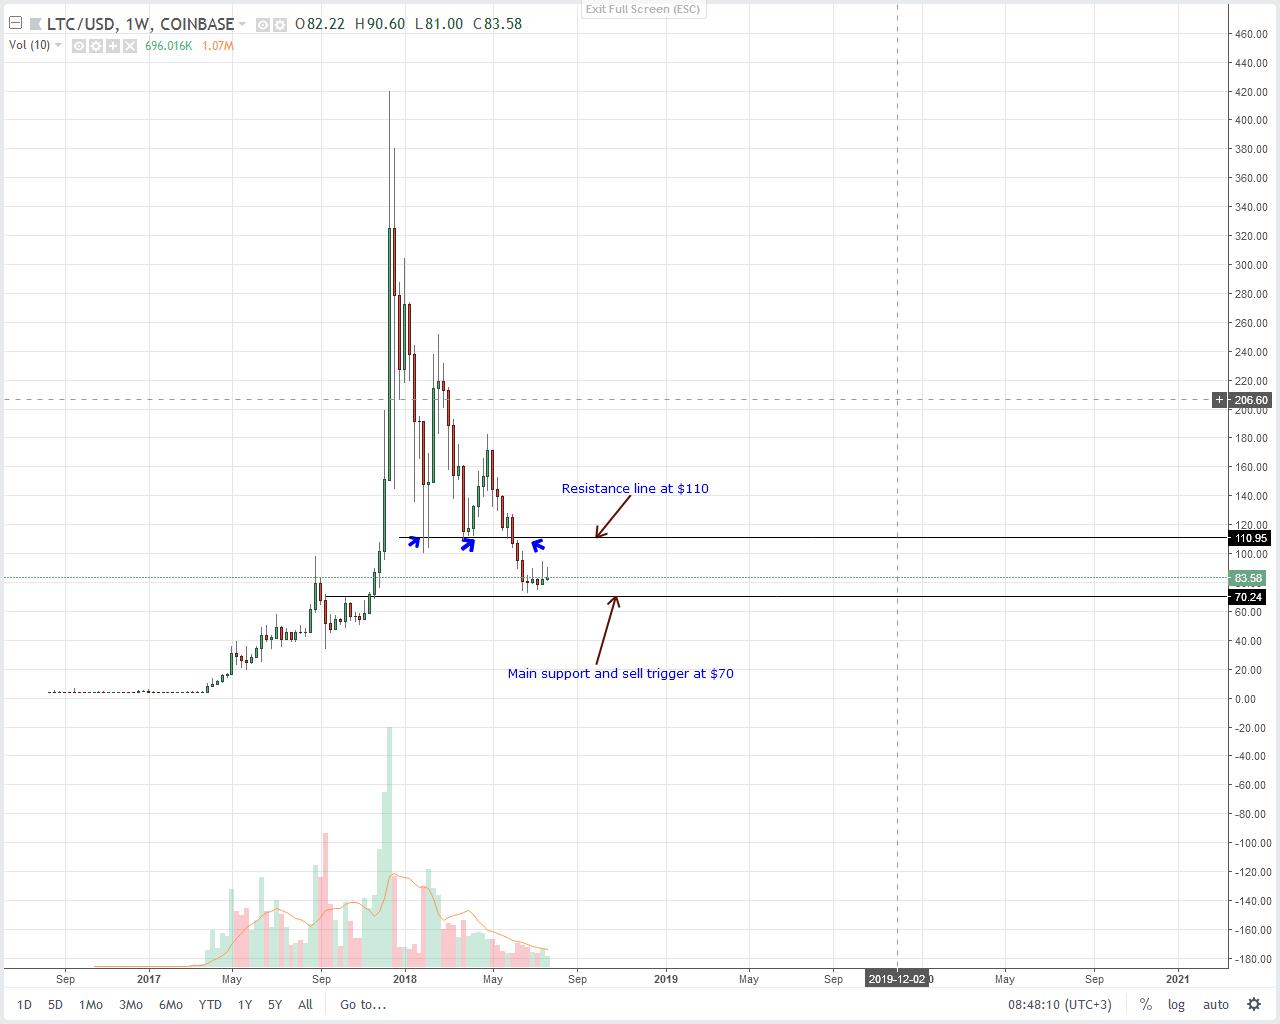
The Litecoin (LTC) price has been decreasing since its rejection at the $63 resistance area on Nov 7. The price should resume its downward movement towards the closest support area.
Deviation Above ResistanceThe LTC price has been moving upwards since Sept 21, when it reached a low of $41.66. On Nov 7, it reached a high of $64.70. The high was made inside a resistance area that has acted as the top since the beginning of August, with the exception of a deviation above it on Aug 17 (shown with the red circle below).
The price dropped sharply and created a bearish engulfing candlestick (red arrow) the same day, and has been falling since.
The closest support area is found near $51, the 0.618 Fib level of the entire upward move, measured from Sept 21.
LTC Chart By TradingViewTechnical indicators on the daily time-frame are bearish, supporting the proposed downward move. There is bearish divergence on both the RSI and the MACD, and they are both decreasing, despite being positive.
Furthermore, the Stochastic Oscillator is in the process of making a bearish cross, which would confirm the bearish trend.
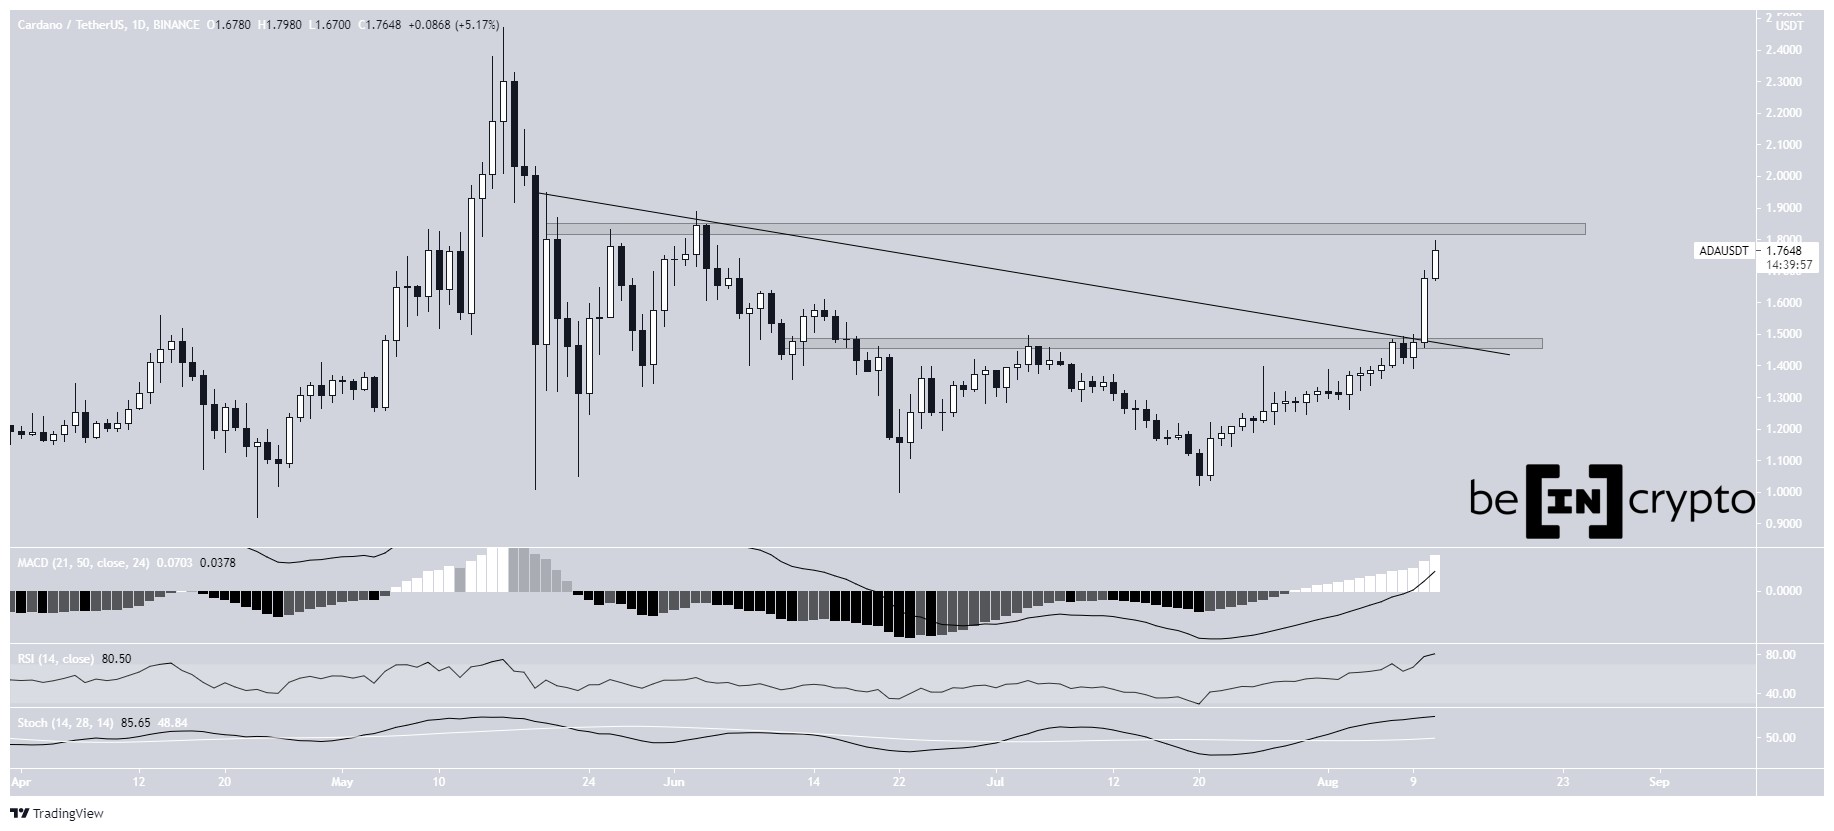
LTC Chart By TradingView Short-Term MovementCryptocurrency trader @CryptoLeos outlined a Litecoin chart, which shows a potential descending wedge, stating that the price is likely to break out from the current pattern.
Source: TwitterHowever, a closer look appears to show LTC trading inside what resembles a descending triangle instead of a wedge.
The price is approaching the point of convergence between support and resistance, and technical indicators have turned bearish. Both the RSI and the MACD are decreasing and are below 50.
Since the descending triangle is also considered a bearish pattern, a breakdown below it is more likely. A breakdown that travels the entire height of the pattern would take LTC down to $51, right at the previously outlined support area.
Chart By TradingView LTC’s Wave CountSince the Aug 17 high, it looks like the LTC price has completed a bearish impulse (shown in black below).
While the ensuing upward move has similarities with a five-wave impulse, the overlap (red line) suggests that it’s a correction instead, with an extended C wave.
If the count is accurate, the LTC price should resume its downward movement, potentially reaching a bottom below the Sept 21 low of $43.22
Chart By TradingView ConclusionThe Litecoin price is expected to continue moving down towards the support area outlined above and may even go lower.
For BeInCrypto’s latest Bitcoin analysis, click here!
Disclaimer: Cryptocurrency trading carries a high level of risk and may not be suitable for all investors. The views expressed in this article do not reflect those of BeInCrypto
The post Litecoin (LTC) is Rejected and Begins Moving Downwards appeared first on BeInCrypto.
origin »Bitcoin price in Telegram @btc_price_every_hour
ETH/LINK Price Action Candlestick Set (LINKETHPA) на Currencies.ru
|
|