2019-6-28 09:37 |
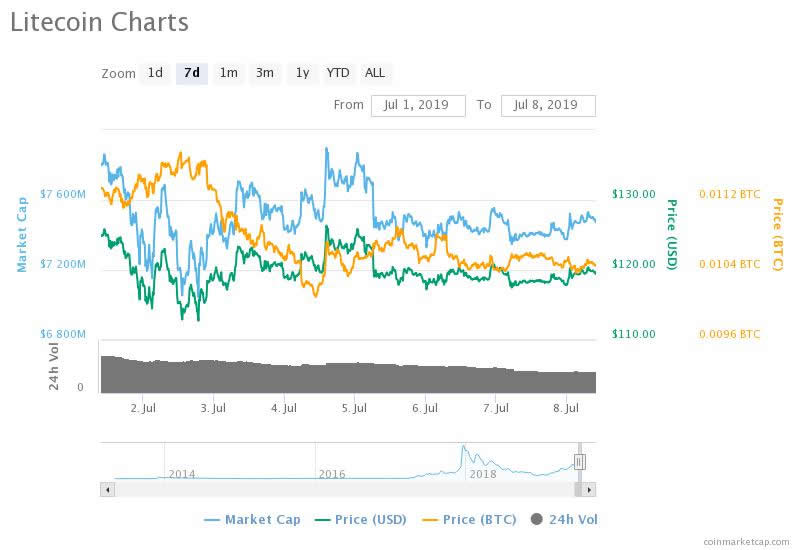
After the new yearly high of $147 on June 22, Litecoin has depreciated almost 25 percent signaling that hype around the upcoming block rewards reduction event could be already priced in.
Litecoin technical analysisOn Aug. 5, 2019, Litecoin will go through a process called halving. This is a fixed event that occurs every four years after 840,000 blocks are mined, reducing the rewards miners get for mining blocks by 50 percent, subsequently, lowering LTC’s inflation rate.
Due to the significant supply reduction, the halving tends to have a direct impact on Litecoin’s market valuation, as evidenced by the previous halving on Aug. 26, 2015.
Following the low of $1.30 on April 26, 2015, LTC entered a 590 percent rally that took its price to reach a high of $8.97 on July 9 of the same year. From that date on, Litecoin began a 73.2 percent correction to trade at $2.40 just one day before the halving took place.
Source: LTC/USD TradingViewToday, just 39 days away from this year’s halving event, different technical indexes are signaling that Litecoin could be preparing for a major correction similar to what happened in 2015.
On the 1-week chart, for instance, an evening doji star candlestick pattern is developing. This is a bearish reversal formation that will be confirmed if next week’s candle opens below the $115 support level. Breaking below this price hurdle could take this cryptocurrency down to the next level of support at $93.5, $70, or even $57.
Source: LTC/USD TradingViewIn addition, the ascending parallel channel where Litecoin’s price action has been contained since mid-December 2018 on the 3-day chart could be about to break because the sell signal given by the green nine candlestick, per the TD Sequential Indicator, has been validated.
Now that the current candle is a red two trading below the previous red one, there is potential for another 8 to 23 days of downward momentum before the continuation of the bullish trend, which could indeed cause a move below the ascending parallel channel triggering a possible trend change from bullish to bearish.
Nonetheless, if the bottom of the channel is able to hold the price of Litecoin from a further drop, once again, it could catapult it to new yearly highs.
Source: LTC/USD TradingViewIf the all bearish signals previously described are validated and history repeats itself, Litecoin could fall another 28 percent to try to test the support given by the 200-day moving average on the 1-day chart just as it did in 2015, which will represent a 53 percent correction from the recent high of $147 all the way down to around $69.
Source: LTC/USD TradingView Overall SentimentAlthough the cryptocurrency market structure has completely changed when compared to 2015 since financial institutions have joined the space and different regulatory forces have also stepped in, most of the market is still driven by sentiment and not fundamentals. A scenario similar to what happened around the first Litecoin halving could be playing out and this cryptocurrency could be about to drop another 28 percent.
From a technical perspective, the last hope for the continuation of the bullish trend is the ascending parallel channel seen on the 3-day chart. If it is able to hold, it could continue to contain Litecoin’s price allowing it to make higher highs and higher lows. However, if it breaks to the downside, further price depreciation seems likely.
The post Litecoin halving approaching and price already showing signs of exhaustion appeared first on CryptoSlate.
origin »Bitcoin price in Telegram @btc_price_every_hour
Litecoin (LTC) на Currencies.ru
|
|


