2019-6-4 13:34 |
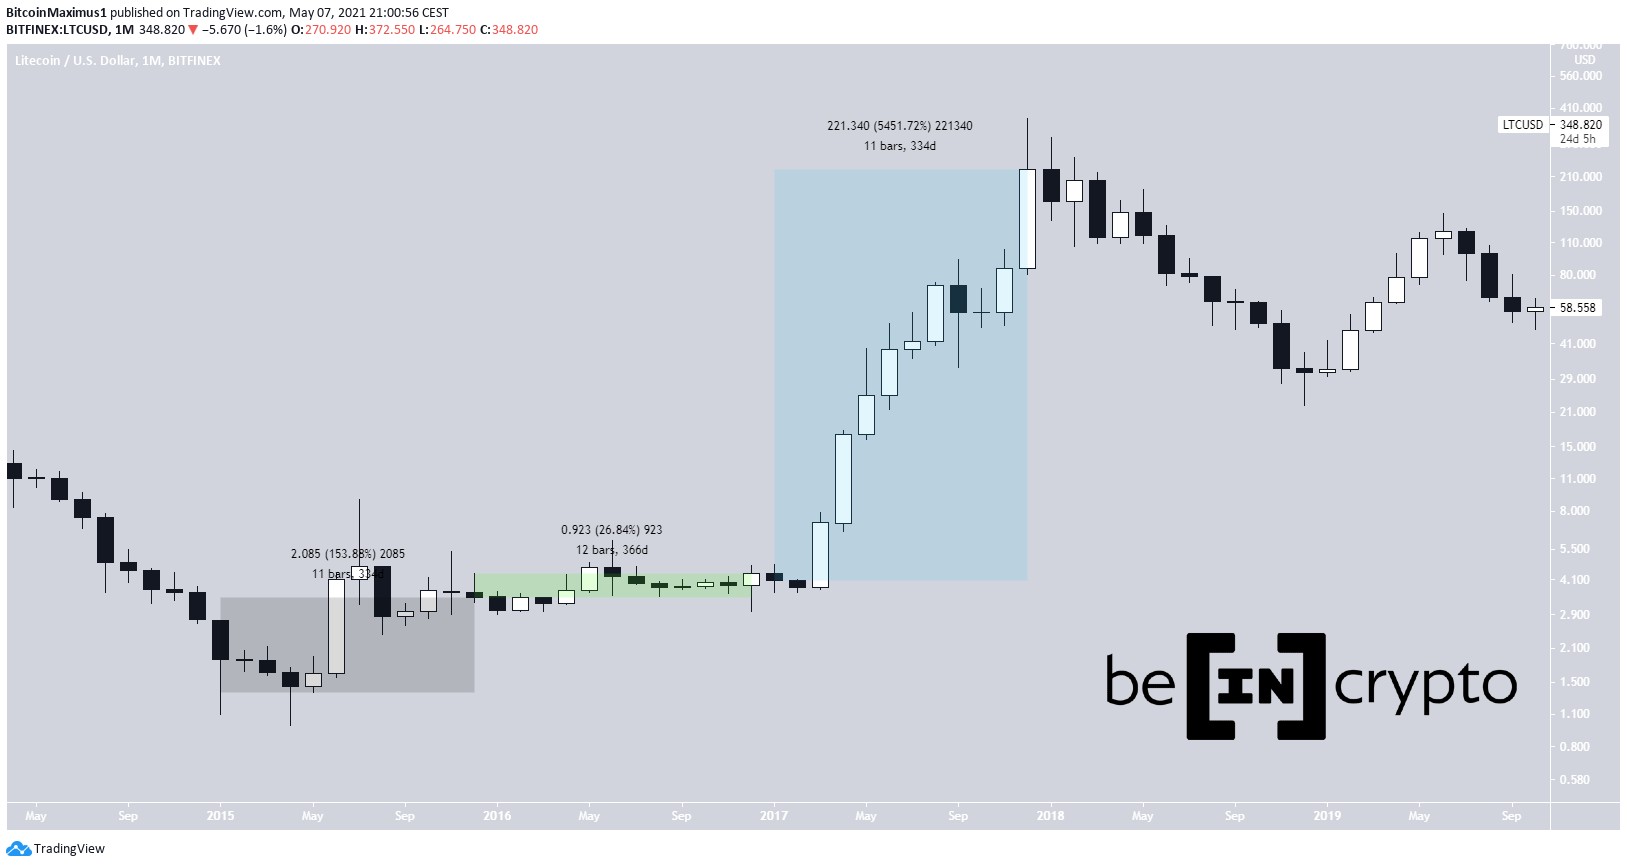
Litecoin Price Analysis LTC / USD Weekly Chart – Source: Tradingview.com
A sharp reversal in the cryptocurrency markets has been taking place over the past 24 hours.
Major cryptocurrencies, including Litecoin and Dash, have been undergoing significant downward movements in USD price.
The last weekly candle for Litecoin / USD price action formed as a Doji after four consecutive weeks of increases.
This indicates traders were uncertain of future price prospects and is being followed up this week with a Marubozu candle forming representative of the significant decline in price.
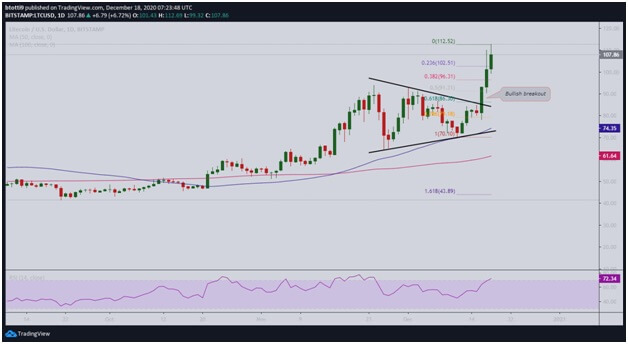
Litecoin / USD Daily Chart – Source: Tradingview.comLitecoin found resistance at $116, a monthly level which provided support during declines in April 2018.
Despite numerous tests of the level, its price started to decline yesterday.
Momentum has started shifting towards sellers with both the daily MACD and RSI declining.
LTC’s price is currently trading at $102 and is likely finding some buying pressure close to $100, an important psychological point for traders.
Litecoin / BTC Daily Chart – Source: Tradingview.comLitecoin is relatively unchanged against market leader Bitcoin during the move.
Bitcoin has also been declining sharply with Litecoin only slightly underperforming it.
Litecoin forms its third consecutive Doji candle on its daily BTC chart showing traders are uncertain regarding price prospects.
Dash Price Analysis Dash USD Daily Chart – Source: Tradingview.comDash similarly recorded significant declines over the past two days price action.
A sharp decline yesterday resulted in the daily USD candle forming with a long lower wick.
Buying pressure quickly came into play as the price dropped below $140 but buying pressure quickly came into play, and the price recovered to close above $154.
The price has been following up with another decline today and has dropped back below $154.
Dash USD Weekly Chart – Source: Tradingview.comDash formed a high in its USD price during trading two weeks ago and has been declining since.
The current downward movements may serve to form a higher low, maintaining a bullish market structure.
Dash BTC Daily Chart – Source: Tradingview.comDash managed to outperform Bitcoin during trading yesterday after its recovery upon dropping below $140.
Today’s price action is following up with a Doji candle reflecting uncertainty from traders regarding future price prospects.
Buying pressure has been coming into play at the 0.0188 BTC level with price testing this level as support for the past three consecutive days.
Key Takeaway: Sharp declines have been taking place across the cryptocurrency market, but these declines may serve to form higher lows giving rise to a bullish market structure. Momentum has been shifting to sellers in both Dash and Litecoin with the daily MACD and RSI declining. Both Dash and Litecoin are relatively unchanged against Bitcoin with Doji candles forming on the daily chart. Latest Litecoin, Dash & Bitcoin News:Litecoin Leads the Crypto Market While Dash Underperforms [Price Analysis]
Bitcoin Future Is the Second Most Traded Asset at the CME (Measured by High Volume/Open Interest Ratio)
DISCLAIMER: Investing or trading in digital assets, such as those featured here, is extremely speculative and carries substantial risk. This analysis should not be considered investment advice, use it for informational purposes only. Historical performance of the assets discussed is not indicative of future performance. Statements, analysis, and information on blokt and associated or linked sites do not necessarily match the opinion of blokt. This analysis should not be interpreted as advice to buy, sell, or hold and should not be taken as an endorsement or recommendation of a particular asset.Litecoin and Dash Drop Sharply Along With the Rest of the Crypto Market [Price Analysis] was originally found on Cryptocurrency News | Tech, Privacy, Bitcoin & Blockchain | Blokt.
origin »Bitcoin price in Telegram @btc_price_every_hour
Litecoin (LTC) на Currencies.ru
|
|